Archives for July 2020

Marcus Bank AARP 0.10% APY Rate Boost, CD Special (EXPIRED)

Update: As of 2026, the partnership between Marcus and AARP appears to have ended. The information on this post is expired.

This is a multi-part deal, but you may already have some of these accounts. Marcus is the online banking arm of Goldman Sachs. AARP members are eligible for two member benefits at Marcus:

  • 0.10% APY rate increase to the Online Savings rate for 24 months. As of 1/18/2021, that means 0.60% APY instead of 0.50% APY.
  • Special 8-month No-Penalty CD at 0.55% APY as of 1/18/2021. Their standard No-Penalty CD is 0.45% APY for 7 months.

AARP membership is targeted at those age 50+, but there is no actual age restriction. I was a member in my 30s, as AARP has offered a variety of member benefits that can be quite valuable – insurance discounts, hotel discounts, restaurant discounts, and so on. If only younger folks had such a well-organized association! The standard membership fee is $16/year, but it drops to $12/year if you sign-up for auto-renewal with a credit card on file (you can still cancel at any time).

Swagbucks is a popular points website, and you can currently get 1,500 Swagbucks (worth $15 Amazon gift card)for joining AARP through their site. This essentially offsetts the AARP annual membership fee. If you are a member, log in and search for “AARP”. If you are not a member yet, join via my Swagbucks referral link and earn a $3 referral bonus + an additional $10 bonus if you spend at least $25 through their shopping portal within 30 days of registration. (There are even some money-making offers on Swagbucks like donating $15 to the Sierra Club and getting 4,000 Swagbucks in return worth $40 in Amazon gift cards.)

Taken altogether, you can get the 0.10% APY rate boost, special CD access, and a year of AARP membership (including many other perks) all at zero net cost. Thanks to reader Bill P for the tip.

Internet Archive / Open Library: Borrow Hard-to-Find Books For 1 Hour

The Internet Archive (IA) is a non-profit digital library with the stated mission of “universal access to all knowledge.” They have a lot going on, from the Wayback machine that archives websites (including this one) to old video games to TV shows to books (also through Open Library).

As a regular user of the local physical library, I often read a book but later recall part of an idea or quote but not the entire context. Since I don’t own the book, I can’t just flip through it and look it up. Recently I’ve often been able to scratch that itch by instantly borrowing the book for an hour via IA.

How can I do this? They operate under the Controlled Digital Lending (CDL) theory of copyright law. My understanding is that they obtain a physical copy of a book, scan it, and then lend out that digital copy on a 1-to-1 basis. Using encrypted digital files, they can ensure that only one person is actually “reading” that book at a time. Once that person returns the book, then another person can borrow it, and so on.

Controlled digital lending is how many libraries have been providing access to digitized books for nine years. Controlled digital lending is a legal framework, developed by copyright experts, where one reader at a time can read a digitized copy of a legally owned library book. The digitized book is protected by the same digital protections that publishers use for the digital offerings on their own sites. Many libraries, including the Internet Archive, have adopted this system since 2011 to leverage their investments in older print books in an increasingly digital world.

They either allow a 1-hour or more traditional 14-day loan period depending on their inventory:

Patrons now have a choice in selecting the loan period when they borrow a book. Patrons can choose a short-term access for 1 hour, or a longer 14-day loan. If we only have 1 copy of a book, it is only available for 1 hour loan. If we have more than one copy of a book, it can be checked out for either 1 hour or 14 days, depending on availability. If there are no copies available for 14-day loans, users can join a waitlist.

However, four major publishers are currently suing the Internet Archive over this practice. I am not a legal expert and can definitely understand how they wouldn’t want the latest bestseller distributed this way as they currently charge libraries a much higher price for lendable eBook versions than physical versions. I can also understand that some authors feel that they are losing book royalties. I certainly wouldn’t want unlimited, unrestricted free digital copies everywhere. But one-to-one for books bought when there was no digital version? Don’t traditional libraries theoretically cut into book sales too? Or do they actually help book sales? Or is the public benefit that makes it okay?

In my experience, every scanned book I’ve read on the Internet Archive would be rather painful to read over longer periods and the text is non-searchable, so the site does not replace my local library nor my regular purchases of new and used books. But I can see how if the convenience improves any further, it could soon make a significant impact.

The Case For Only Looking At Your Portfolio Balance Once A Year

There are many excellent insights within Fooled by Randomness: The Hidden Role of Chance in Life and in the Markets by Nassim Nicholas Taleb. A useful everyday tip is that you should accept that you have behavioral biases and that they don’t go away even after you become aware of them. (We all think we are more rational than average.) Instead, we should actively construct ways to avoid them.

One example within the book deals with separating noise and signal (meaning) within investing. Let’s say you have a dentist that can invest with a 15% average annual return with 10% annual volatility. For reference, the S&P 500 index has a ~10% average annual return and ~14% average annual volatility. The dentist has good thing going, with the portfolio doubling in value every 5 years on average.

An unexpected factor in his success is the frequency upon which he looks at his portfolio balance. Here’s a chart from the book showing the probability of a positive change in value based on how often the portfolio is checked.

If he were to check his portfolio every minute, he would only see a positive return 50.17% of the time. That is basically indiscernible from a coin flip. The problem is loss aversion.

Being emotional, he feels a pang with every loss, as it shows in red on his screen. He feels some pleasure when the performance is positive, but not in equivalent amount as the pain experienced when the performance is negative.

At the end of every day the dentist will be emotionally drained. A minute-by-minute examination of his performance means that each day (assuming eight hours per day) he will have 241 pleasurable minutes against 239 unpleasurable ones. These amount to 60,688 and 60,271, respectively, per year. Now realize that if the unpleasurable minute is worse in reverse pleasure than the pleasurable minute is in pleasure terms, then the dentist incurs a large deficit when examining his performance at a high frequency.

Again, this doesn’t go away even if you know about the phenomenon:

Regardless of what people claim, a negative pang is not offset by a positive one (some psychologists estimate the negative effect for an average loss to be up to 2.5 the magnitude of a positive one); it will lead to an emotional deficit.

Now, if he were to check that same portfolio only when his monthly statement arrives, he would see a positive return 67% of the time (2 out of 3). Finally, if he has the patience to check only once a year, she would see a positive return 93% of the time. The time scale matters.

Unfortunately, the S&P 500 is not quite that good, but it has posted a positive total return roughly 75% of the time from 1928-2017. (Total return includes dividends. You’ll get a slightly lower number if you just look at the index without dividends.)

This becomes even worse during bear markets when the down days outnumber the up days for a while. Our brains are simply not well-suited to handling that kind of repeated pain. The solution is to block out the noise. Don’t check your portfolio as often and over time, you will hopefully experience a lower likelihood of bailing out during a market drop.

This is the reason why I don’t do monthly asset class returns any more, and only do them annually nowadays. There is too much noise in monthly returns. I wish I could say I only look at my portfolio annually, but that is starting to sound like a good idea too!

US Treasury Yields Lowest In The History of the Republic

Like many folks, I recently enjoyed the excellent musical Hamilton for the first time on Disney+. I’m a bit embarrassed to say it was also very educational (yes, I know its not 100% historically accurate). I never really thought about how precarious and up-for-debate everything was during the beginning of this country. If Hamilton never survived the war or wasn’t as persuasive, would there be a federal Treasury? I feel like the creator of this WSJ Daily Shot chart was also reading about US history – “US Treasury Yields Lowest In The History of the Republic”:

Alexander Hamilton was the first Secretary of the Treasury and is known as the “Father of American Banking”. Here is his Treasury website bio:

Facing a chaotic treasury burdened by the heavy debt of the Revolutionary War, Hamilton’s first interest when he took office was the repayment of the war debt in full. “The debt of the United States … was the price of liberty,” he affirmed, and he then put into effect, during 1790 and 1791, a revenue system based on customs duties and excise taxes. Hamilton’s attack on the debt helped secure the confidence and respect of foreign nations. He introduced plans for the First Bank of the United States, established in 1791 which was designed to be the financial agent of the Treasury Department. The Bank served as a depository for public funds and assisted the Government in its financial transactions. The First Bank issued paper currency, used to pay taxes and debts owed to the Federal Government.

Today, the rates on US Treasury debt are at all-time lows, while the debt-to-GDP ratio is currently higher than any time since World War II (now over 100% of GDP). The projections are from the Congressional Budget Office, made even before the events of 2020.

I will be the first to admit that I don’t understand macroeconomics. At the same time, I wish that the “experts” would admit when they don’t really know that will happen in the future either.

Rational Expectations: Advanced, Specific, Practical Portfolio Advice

The fourth and final book in the “Investing for Adults” series by William Bernstein is Rational Expectations: Asset Allocation for Investing Adults. In Book 1: The Ages of the Investor, I learned to take advantage of a lucky streak in stocks and stop when I’ve won the game. In Book 2: Skating Where the Puck Was, I learned why it’s so hard to find any “new and improved” asset classes. In Book 3: Deep Risk, I learned about the scenarios that have led to permanent capital loss.

This final book includes the most specific advice about constructing your retirement portfolio. The entire series is great (and honestly not very long even read back-to-back), but this final book is especially dense with additional practical ideas for those that are already comfortable with investing basics. This isn’t at all scientific, but upon counting my Kindle highlights, Book 4 had 75 highlighted passages vs. 33, 25, and 36 respectively for Books 1-3. I’m only going to touch on the few that directly impacted my own portfolio construction.

Stocks. Here is an excerpt regarding how much of your portfolio should be allocated to international stocks.

Deployment among stock asset classes is relatively easier. The obvious place to start is with the total world stock market, as mirrored reasonably well by the FTSE Global All Cap Index, which in early 2014 was split 48/52 between U.S. and foreign equities. From there, we make three adjustments to the foreign allocation, two down and one up. First, the downs: if you’re like most people, your retirement liabilities will be in dollars, so a 52% foreign allocation is inappropriately high. Second, foreign stocks not only are slightly more difficult and expensive to trade but also are subject to foreign tax withholding. This presents no problem in taxable accounts, since those taxes will offset your liability to the IRS, but you lose that deduction if you hold foreign stocks in a sheltered account.

The up adjustment is a temporary one, since foreign stocks, as was discussed in chapter 1, currently have higher expected returns. So at the time of this writing, a foreign stock allocation somewhere in the 30% to 45% region seems reasonable.

Simplifying all that, as of early 2014, the middle recommendation would be roughly 60/40 US/international while the world market cap weighting was roughly 50/50. A little home bias is recommended for US investors.

As of mid-2020, the world market cap weighting is 57% US and 43% International (source), which you might round to 60/40. The adjustments are mostly the same, except that foreign stocks probably have even slightly higher future expected returns as the US stocks keep climbing. If you want to maintain a slight home bias, I would speculate this might change the recommended range closer to 65/35 or 70/30?

Bonds. The recommended list includes short-term US Treasuries/TIPS, bank CDs, and investment-grade municipal bonds. Bernstein is not a fan of corporate bonds.

Sooner or later, we’re going to have an inflationary crisis, and in such an environment, long duration will be a killer. Stick to short Treasuries, CDs, and munis.

Own municipal bonds via a low-cost Vanguard open-ended mutual fund for the diversification. Own Treasury bonds and TIPS directly, as there is no need for mutual funds or ETFs since they all have the same level of risk. Own bank CDs and credit union certificates under the FDIC and NCUA insurance deposit limits.

Asset location. I found this advice about spreading your holdings across Traditional IRAs, Roth IRAs, and taxable accounts to be very useful and practical. Importantly, this may be somewhat different that what you have read elsewhere. I don’t want to summarize incorrectly, so I will just use the excerpts:

To the extent that you wish to rebalance the asset classes in your portfolio, all sales should be done within a sheltered account. If possible, you should house enough of each stock asset class in a sheltered account so that sales may be accomplished free from capital gains taxes. Next, all of the REIT allocation certainly belongs in the sheltered portfolio, since the lion’s share of their long-term returns come from nonqualified dividends.

The real difference made by location occurs at the level of overall account returns. In terms of tax liability, Traditional IRA/Defined Contribution > Taxable > Roth IRA. This means that, optimally, you’d like to arrange the expected returns of each account accordingly, with the highest returns (i.e., highest equity allocation) optimally occurring in the Roth, and the lowest returns (i.e., lowest stock allocation) in your Traditional IRA/Defined Contribution pool. To the extent that this is true, it conforms with the stocks-in-the-taxable-side argument. That said, for optimal tax-free rebalancing, unless your Roth IRA is much bigger than your traditional IRA, you’re still going to want some stock assets in the latter.

It is definitely nice to be able to rebalance and not have to worry about picking stock lots, making sure you have the right cost basis at tax time, and paying capital gains taxes.

Money in Excel Review – Good For Budget Tracking, Bad For Investments

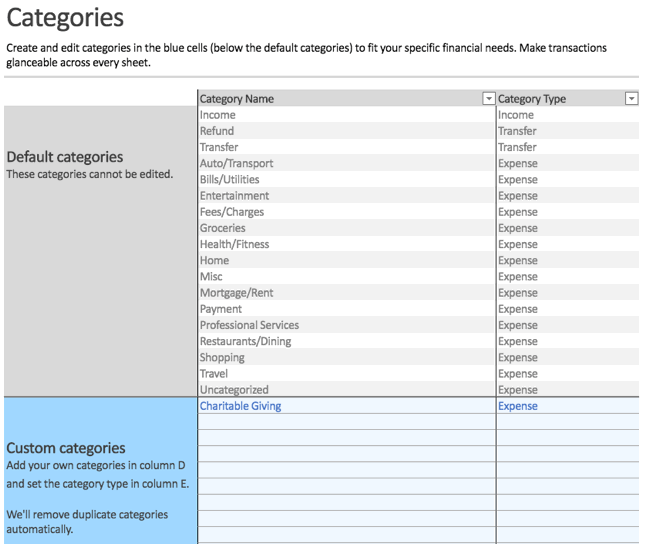
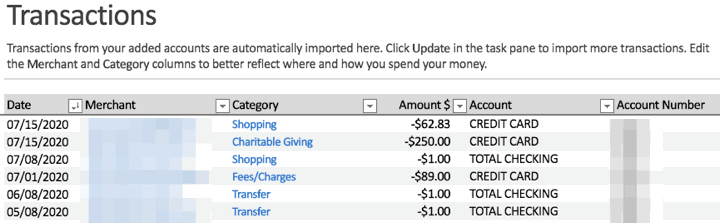
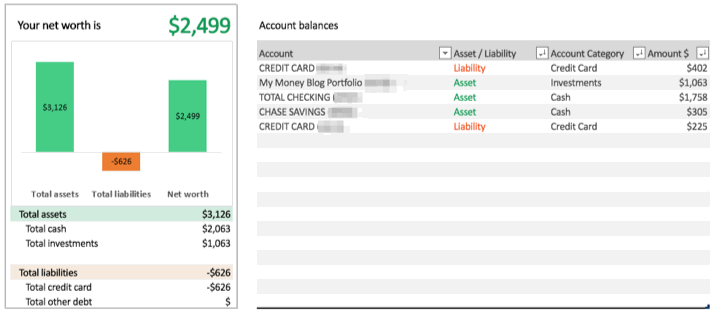
Thanks to generous assistance from a reader, I was able to spend some time poking around the new Money in Excel template for Microsoft 365 Personal or Family subscribers. Does it fulfill its promise of helping you “see all your financial accounts in one place, make a plan, and reach your financial goals”? Here’s my rundown of the features that were included and those that were missed.

Accounts Toolbar. After following the clear installation instructions, you can add your various financial accounts using the toolbar on the right-hand side. (I just connected a few secondary accounts for review purposes.) Plaid is used for account aggregation, where you provide your login and passwords and they use that to grab your account balances and transaction history. This data import feeds the rest of the Excel worksheet, but the panel itself is a useful at-a-glance snapshot of your finances. The feel is very similar to the “Overview” page on the Intuit Mint app.

Customized Categories. In the “Categories” worksheet, you can create and edit the names of custom categories used to organize your transactions. For example, I added “Charitable Giving”. You can’t edit the original, default categories.

Transactions. You then move onto the “Transactions” worksheet, where you can edit the categories assigned to each specific imported transaction. If you have a lot of transactions across different bank and credit card accounts, this provides a handy aggregate view of everything together.

Spending analysis. For the most part, this template is about budgeting and spending. Once have all your transactions imported and categories, it will generate some basic charts and provide some simple insights into your expenses. Here are some examples:

  • Spending breakdown by category
  • Current vs. previous month spending
  • Cumulative spending over the month
  • Net worth calculation (assets minus liabilities)
  • Top merchant: Where did you spend the most money?
  • Bank fees: How much are you paying in fees?
  • Subscriptions: Where are your recurring expenses?

This is all useful for someone trying to understand their spending and developing their own budgeting system, but it’s definitely not groundbreaking. Mint.com has providing this type of service for many years. The main differences are that there are no pesky advertisements inside your own Excel worksheet, while the Mint smartphone app may be more convenient.

Missing: Holdings, asset allocation, performance tracking. I am able to connect to an investment account, but it only shows me the total dollar balance. That’s it, as far as I can tell. There is no data on individual holdings, no asset allocation breakdown, no performance tracking.

Missing: Investment transaction list. I am not able to see historical buy/sell transactions on a simple view-only basis, like on the credit card side. It would be nice just to see the last 10 transactions, for example.

There are other portfolio spreadsheets where you can manually input ticker symbols and share counts and they’ll pull in market quotes, but that doesn’t adjust for events like dividends, stock splits, and dividend reinvestment. I was hoping to create a single portfolio spreadsheet using the imported data cells from my brokerage accounts, one that would provide a live view of all my investment accounts, but also allow me to manipulate those data in order to determine if/when to rebalance my portfolio.

For now, I will have to stick with my existing system using both Personal Capital and a custom Google Spreadsheet to track my investment holdings. The Personal Capital financial tracking app (free, my review) automatically logs into my accounts, adds up my balances, tracks my performance, and calculates my asset allocation. Then, I use my manual Google Spreadsheet (free, instructions) to help me calculate how much I need in each asset class to rebalance back towards my target asset allocation.

Bottom line. The “Money in Excel” template for Microsoft 365 Family and Personal subscribers is a free, basic template that imports your spending transactions across different bank and credit card accounts. It can help you with monthly budgeting, but not much beyond that. I hope that in the future they expand it to investment accounts and allow you to have more control over your data. It would also be nice if they made it free for everyone with access to Excel, not just Microsoft 365 Family and Personal subscribers.

NBC’s Peacock TV Streaming Service Has a 100% Free Tier

Just a quick note that there is a new streaming service, Peacock by NBC Universal. What makes it different than Netflix, Disney+, Hulu, and other services is that it has a 100% free tier (with ads) that includes a lot of decent content including “live” channels. (I might finally watch Downton Abbey.) No free trials. You don’t even need a credit card to sign up. There are also two Premium tiers ($5/month with ad and $10/month without ads).

Small catch: NBC is negotiating with Roku and Amazon (Fire TV devices) about money, so right now you won’t find Peacock on those devices. There is an iOS app, Android app, Apple TV, Chromecast, LG/Vizio smart TV channel, XBOX One, and you can always just watch from a web browser.

Country Time Bailout: Kid’s Lemonade Stand $100 Stimulus Check

The summer lemonade stand remains the iconic entrepreneurial opportunity for kids. Well, maybe not this summer. Country Time Lemonade is starting the Littlest Bailout Relief Fund, which is a $100,000 fund to send $100 stimulus checks to 1,000 kids who had to close their lemonade stands due to COVID-19. To enter the random drawing, you must attest to being the parent or legal guardian of a child 14 years or younger that actually operated a lemonade stand. You must also attach a picture of the child’s lemonade stand, and they will review all submissions.

Sure, it’s a publicity stunt, but at least it’s a fun one. Two years ago, Country Time Lemonade offered “Legal-ade” to reimburse any permit fees or fines incurred by a child trying to operate a lemonade stand.

Here is a local news story I shared on Twitter with some real-world kid businesses: Lego kit rentals, mobile baseball lessons, and tutoring/swim lessons. Here is an older WSJ article on teens making serious money doing iPhone repairs.

Pizza Hut Camp Book It! Kids Summer Reading Program

Some of you may remember the Pizza Hut “Book It!” program during your elementary school years that encouraged reading using free pizza as a reward. Well, it still exists in the form of Camp Book It!:

Parents, join us for our first ever Camp BOOK IT! and keep rewarding your kids all summer long. Track and reward your kids’ reading for June, July and August in our digital dashboard. When they meet their monthly reading goal, they’ll receive a free one-topping Personal Pan Pizza® from Pizza Hut! We’ll also share fun activities and book recommendations each week to keep the fun going throughout the summer!

This program is usually for homeschooling parents during the academic school year, but is open to all age-eligible children during the summer:

You must be one of the following: a parent homeschooling your own children in Kindergarten through 6th grade (ages 5-12 years old) as of September 1, 2020 for the October to March program OR a parent enrolling your own children in Kindergarten through 6th grade (ages 5-12 years old) as of September 1, 2020 for the summer program.

After signing up, I found that this program is much less involved than the one we signed up for at our local library, which requires us to log the book title, author, and time spent reading for each day. For Camp Book It, there is a simple daily counter. You can even count the days retroactively if you sign up in the middle of the month. Once you reach 20 days of reading in one calendar month (our goal is 20 minutes per day per child), you complete the goal and a prize code will be emailed to you.

I like that they give out little Personal Pan Pizzas as they are a novelty to our kids, making it feel like a special reward that they earned. Read books, earn free pizza, that’s my kind of deal!

Protecting Your Portfolio From Hyperinflation, Deflation, Confiscation, and Devastation

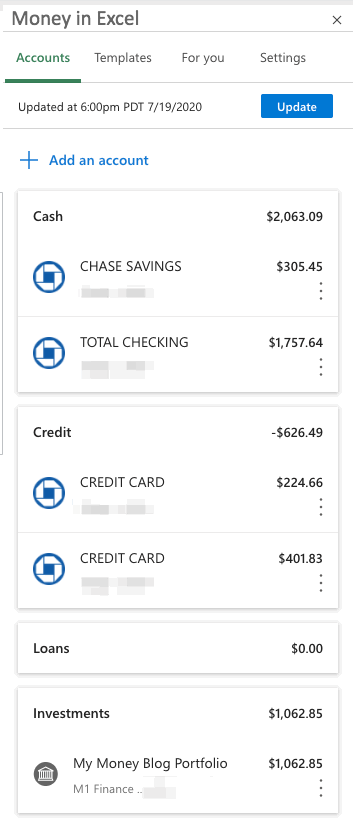
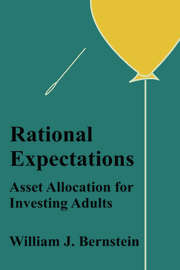
The third book in the “Investing for Adults” series by William Bernstein is Deep Risk: How History Informs Portfolio Design. As before, I’m just trying to pull out a few practical takeaways rather than summarize the entire book. In Book 1: The Ages of the Investor, I learned to take advantage of a lucky streak in stocks and stop when I’ve won the game. In Book 2: Skating Where the Puck Was, I learned why it’s so hard to find any “new and improved” asset classes.

The main problem addressed in this book is “deep risk”, the permanent loss of real (inflation-adjusted) capital. This contrasts with “shallow risk”, in which the value of something usually rebounds within 5-7 years or less.

Here are some deep risks that you can offset by purchasing insurance (and be happy if you never have to use it!).

  • Death of income earner.
  • Long-term health disability.
  • Legal risk – lawsuit with large judgment.
  • Select types of asset loss (i.e. theft, building fire).

Unfortunately, there are other deep risks against which you can’t buy insurance.

  • Hyperinflation, prolonged and severe.
  • Deflation, prolonged and severe.
  • Confiscation by government.
  • Devastation (war).

Over an extended period of time, history has shown us that “safe” bonds are often more sensitive to deep risk than stocks. Many countries saw 100% losses for their bondholders, while partial ownership in a business survived wars and regime changes. An example given was in Germany after World War II. Bonds are also at risk for inflation, while a 30-year fixed-rate mortgage (a negative bond) can be a great inflation hedge.

A portfolio of internationally-diversified stocks is the most practical way to protect yourself from both inflation and deflation. Historically, inflation is much more likely than deflation. You might have an event in one country, but it would be very rare to have a large majority of nations experience severe inflation and low stock returns all at the same time. In such a case you’d be looking at global devastation.

As for local confiscation and local devastation, you would be looking at foreign-held assets, foreign property, perhaps the right passports, and a plan to escape in a timely manner. This sounds like something that a billionaire might pay someone else to set up, but not so sure how practical it would be for most people.

Bernstein offers his own summary:

This booklet’s primary advice regarding risky assets is loud and clear: your best long-term defense against deep risk is a globally value-tilted diversified equity portfolio, perhaps spiced up with a small amount of precious metals equity and natural resource producers, TIPS, and, if to your taste, bullion and foreign real estate.

I admit that I am somewhat fascinated by worst-case scenarios, and I recommend reading the entire book for the full discussion. But in the end, my primary takeaway is that if you have a globally-diversified stock portfolio, you’ve done most of what you can in terms of deep risk. The rest is the same advice as before: consider TIPS if you have enough money, maximize Social Security, and keep some nice safe bonds and bank CDs for short-term needs (shallow risk).

Free Social Security Tool for Optimal Benefit Claiming Strategy

Update: The free Open Social Security tool has been updated to include a new “heat map” visualization that illustrates the relative values of claiming Social Security at different ages. Details here. Here is a sample graph for a couple with similar income histories and the same age:

For this situation, we see that the worst expected outcomes would occur if both individuals claimed really early. The best expected outcomes occur when one claims relatively early and the other claims relatively late.

Original post:

socialsecuritycard
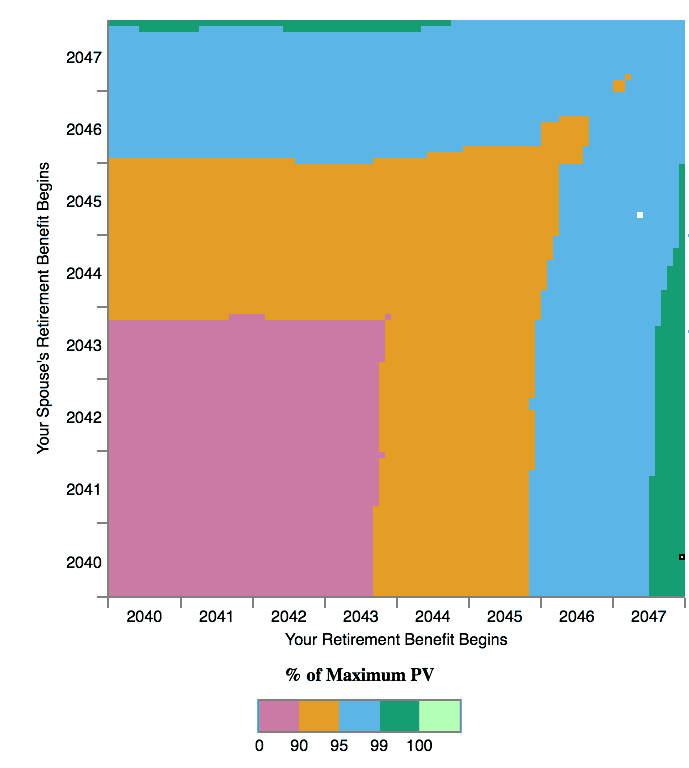
When to start claiming Social Security to maximize your potential benefit can be a complicated question, especially for couples. There are multiple paid services that will run the numbers for you, including Social Security Solutions (aka SS Analyzer) and Maximize My Social Security, which cost between $20 and $250 depending on included features.

Mike Piper of Oblivious Investor has created a free, open-source calculator called Open Social Security. To use the calculator, you will need to your Primary Insurance Amount (PIA). This amount depends on your future income, so I would first consult this other free Social Security benefit estimator tool to more easily estimate your PIA. I believe the value you see at SSA.gov assumes that you will keep working at your historical average income until your claiming age (which won’t be the case for us).

Here are our results as a couple, assuming we were the same age (we are close) and with my expected benefit being slightly higher than hers:

The strategy that maximizes the total dollars you can be expected to spend over your lifetimes is as follows:

You file for your retirement benefit to begin 12/2047, at age 70 and 0 months.
Your spouse files for his/her retirement benefit to begin 4/2040, at age 62 and 4 months.

The present value of this proposed solution would be $657,749.

Basically, the tool says that my wife should apply as soon as possible, while I should claim as late as possible. I believe this is because this scenario allows us claim at least some income starting from 62, and if I die first after that, my wife would still be able to “upgrade” to my higher benefit.

The tool might take some time to run the calculations, depending on your browser. You can learn more and provide feedback at Bogleheads and Github.

I am not a Social Security expert, and am not qualified to speak to the accuracy of the results. However, Mr. Piper is the author of the highly-rated book Social Security Made Simple, has a history of doing thorough work, and the tool has been around a while now. If I were close to 62, I would probably also use the paid services for a second and third opinion. Why? Spending $100 now could save you many thousands in the future.

The best thing about this free tool is that it can introduce a lot of people to ideas that they would have not otherwise considered. Even if it lacks every bell or whistle, being free means it can help more people. Many spouses wouldn’t think of having one claim as early as possible (age 62), and then have the other claim as late as possible (age 70). It’s not common sense unless you understand the inner workings of Social Security.

3 Months of SiriusXM Streaming + Echo Dot For $1

Here is a SiriusXM promotion link where you can sign up for a free 3-month trial of either their Essential or Premium streaming tiers (includes Howard Stern) and also get an Amazon Echo Dot (3rd Gen) smart speaker for only $1.

After signing up, you will be emailed a promo code for the Echo dot that you redeem at Amazon.com. You will need to provide a credit card and cancel before the end of the 3-month trial, otherwise your subscription will start and you will be charged the monthly fee.

Added: There are some complaints that SiriusXM has an aggressive retention team. You may find this online form useful, but make sure you follow-up in case they “forget” to cancel your account.