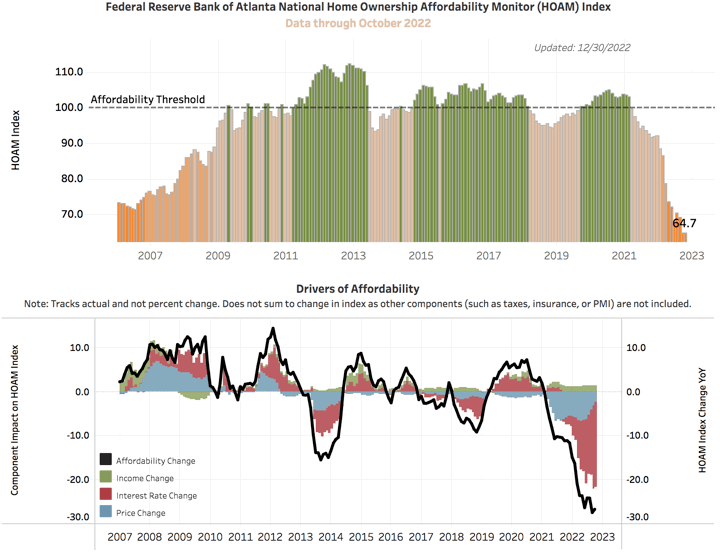
The recent double-whammy of rising home prices and quickly rising interest rates has created a drop in home sales. The Federal Reserve Bank of Atlanta created the Home Ownership Affordability Monitor (HOAM) Index, which tracks the ability of a median-income household to afford a median-priced home. The index uses median home price, median income, prevailing interest rate, median monthly principal and interest (P&I) payment, total median monthly payment (including P&I, taxes, insurance, and private mortgage insurance [PMI]), and annual total payment share of median income. “Affordability” is defined using the HUD threshold of total housing payment staying under 30% of income. It’s very interesting to track the changes and the factors behind those changes over the last 15+ years. Found via The Big Picture.
As you can see, we are back at the lowest level of home affordability since the 2007 housing bubble period. However, the Financial Times (paywall?) argues that since most existing homeowners have a low-interest, fixed-rate mortgage, there won’t be much forced selling or steep price drops in the near future.
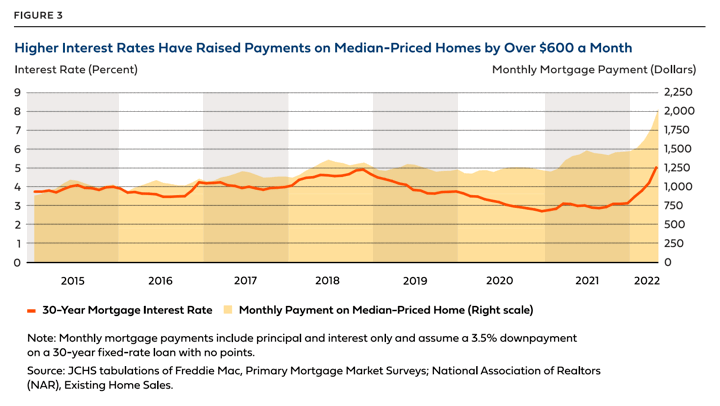
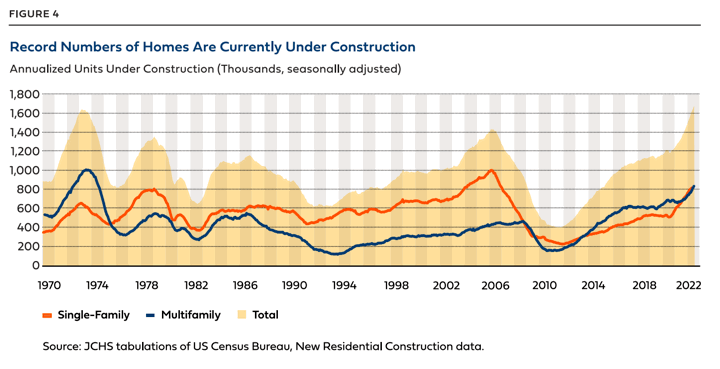
The Atlanta Fed also points out several other home affordability tracking sites, including the Joint Center for Housing Studies of Harvard University. Their The State of the Nation’s Housing 2022 report points out that while the average monthly payment required has risen significantly, there is also a historically high amount of housing under construction (after a big slowdown after 2007).
I do believe that home affordability will eventually rebound, but there are several ways that could work out. More housing supply and/or reduced affordability could reduce prices, incomes could rise (or at least incomes could rise with inflation while housing prices stay flat), or interest rates could go back down due to a recession that calms inflationary pressures.
 The Best Credit Card Bonus Offers – 2026
 Big List of Free Stocks from Brokerage Apps
 Best Interest Rates on Cash - 2026
 Free Credit Scores x 3 + Free Credit Monitoring
 Best No Fee 0% APR Balance Transfer Offers
 Little-Known Cellular Data Plans That Can Save Big Money
 How To Haggle Your Cable or Direct TV Bill
 Big List of Free Consumer Data Reports (Credit, Rent, Work)
Speak Your Mind