 If you have accumulated some savings bonds but don’t really enjoy logging into TreasuryDirect.gov all the time, here are some alternative methods to tracking your balances over time. Each has its own strengths and weaknesses, and the unofficial ones are the results of motivated DIY investors. As an example, I will track a Savings I Bond purchased in April 2013 for $10,000.
Official TreasuryDirect Savings Bond Calculator
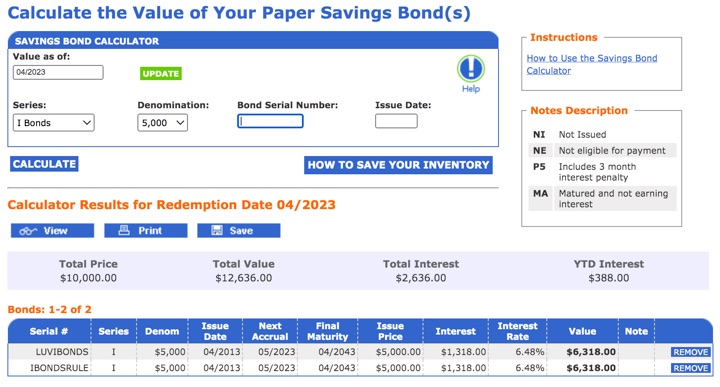
Although this official calculator states that it is only meant for paper savings bonds, you can still use it indirectly to track electronic savings bonds (they have the same value as long as they are issued the same month). For example, let’s say you bought $10,000 of I Bonds issued in April 2013. While you can’t enter a $10,000 value directly, you can enter two $5,000 I Bonds. (Enter anything for serial number.) Thus, you’d see that as of April 2023, they are worth $12,636.
You can even save your entire inventory of specific I bonds if you follow the directions here. It feels a bit archaic (you’re basically saving a plain text .html file), but it works. You can even import the values into Google Sheets, according to this Bogleheads forum post.
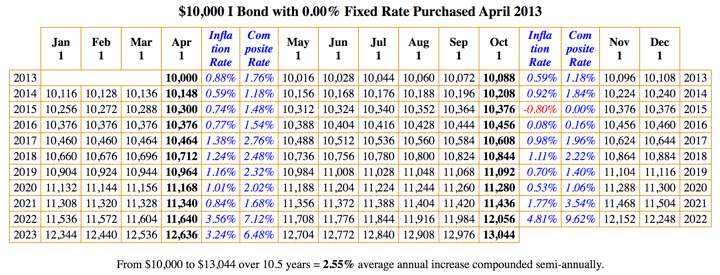
Created by a user on the Bogleheads forums, this is a very handy and simple website that tracks the price of every savings bonds based on the issue date. For April 2013, simply click on that date and see the growth in value shown below. As of April 2023, you get the same $12,636 value and since the rate is known for the next 6 months as well, you can see the value all the way out to October 2023. This may lead to the easiest way to import the values into your own custom Google Sheet; check out Bogleheads forum post.
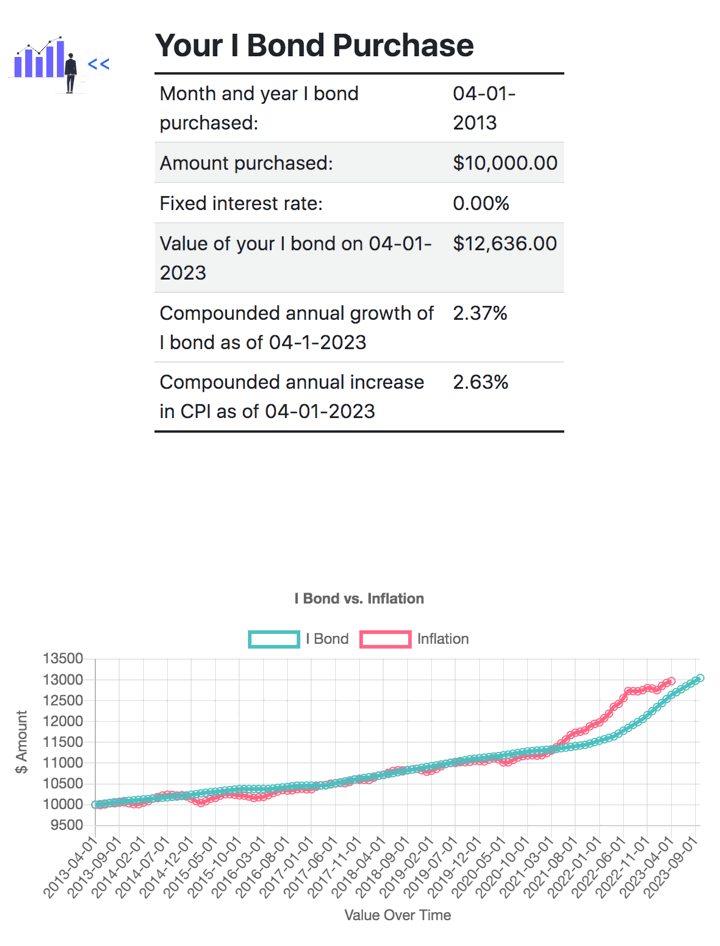
This site also allows you to look up the price history of savings bonds based on the issue date. For April 2013, there are the same ending values along with a chart comparing the value against CPI inflation. You can also quickly create a list of multiple savings bonds here, although it doesn’t appear to allow you to save it for later.
(I personally use these tools once in a while for research, but for tracking balances I simply log into TreasuryDirect.gov during my quarterly portfolio updates and manually enter the values into my Google Sheets page under the “Inflation-Protection Bonds” asset class. It’s only four times a year, and I like to log into the official retro website to make sure my money is still there.)
 The Best Credit Card Bonus Offers – 2026
 Big List of Free Stocks from Brokerage Apps
 Best Interest Rates on Cash - 2026
 Free Credit Scores x 3 + Free Credit Monitoring
 Best No Fee 0% APR Balance Transfer Offers
 Little-Known Cellular Data Plans That Can Save Big Money
 How To Haggle Your Cable or Direct TV Bill
 Big List of Free Consumer Data Reports (Credit, Rent, Work)
Jonathan, I discovered a much better way to use the official TD calculator, that bypasses it’s limitations.
Install app “Savings Bond Calculator Plus” to your phone
Add in all of your bonds
Export the results to a file accessible to your PC (I use Google drive) in html format (not csv)
Click on the header button “Go to Savings Bond Calculator”
Your entire portfolio of bonds will be presented on the official calculator without logging in, even though it states it is only for paper bonds (and you will be able to see future values for up to the next six months):
Thanks, I hadn’t heard of the app before, will check it out.
Super handy, thanks! Was so annoying to log in to the Treasury website every time I wanted to check the value. The EyeBonds one paired with the Bogleheads Google Sheets instructions worked great!
Check out https://microsoftmoneyoffline.wordpress.com/2021/01/16/u-s-series-i-savings-bonds/#calc for a more clever method of using the official calculator.
I really miss the Savings Bond Wizard which was simple to use. Then Treasury direct eliminated it. It was perfect for paper bonds.
For online inventory I find the treasury direct easy to use. JUST don’t lose your password or you are on hold for up to 8 hours to retrieve it.
Looks like the app will Import from retired Treasury Savings Bond Wizard ™. I never used the wizard, but it is apparently still available: https://download.cnet.com/Savings-Bond-Wizard/3000-2057_4-10068996.html
I did some searching around a while back and created a simple spreadsheet, I have since lost the references to where I found how interest is actually computed. Apparently, interest is computed on every $25 of your initial investment so one would track a single $25 bond and multiply for the number of 25s one has regardless of the face value of the bond.
Interest is compounded every 6 months so at the end of each 6 month period the value “A” of each 25 at the end of the prior 6 month period becomes A*(1+rate_percent/200).
This has matched every single month for bonds I carry since about 2015 when shifting for the 3 month penalty and matches the jump seen when the penalty dissapears.
So for example, each month multiply by (1+rate_percent/200)^(1/6), then round to two decimals and multiply by the number of 25s .
Example:
Rate total value at beginning of month
$25.00 $10,000.00
9.62 25.1965 $25.20 $10,080.00
9.62 25.3946 $25.39 $10,156.00
9.62 25.5942 $25.59 $10,236.00
9.62 25.7954 $25.80 $10,320.00
9.62 25.9981 $26.00 $10,400.00
9.62 26.2025 $26.20 $10,480.00
6.48 26.3396 $26.34 $10,536.00
6.48 26.4800 $26.48 $10,592.00
6.48 26.6211 $26.62 $10,648.00
6.48 26.7629 $26.76 $10,704.00
6.48 26.9055 $26.91 $10,764.00
6.48 27.0489 $27.05 $10,820.00
the first row with a new rate takes the last rounded value so for the first 6.48% :
26.3396=26*(1+6.48/200)^(1/6) and 10536=(10000/25)*26.34
the second row for 6.48% is
26.4800 = 26.3396*(1+6.48/200)^(1/6) and 10592=(10000/25)*26.48
If one is paying 3 month penalty, the above will be available 3 months later and that is what Treasury direct gives you for paper bonds and your balance in electronic bonds.
Another way of looking at this is that if one starts with 25, one has
1st month 25*(1+rate_percent/200)^(1/6)
2nd month 25*(1+rate_percent/200)^(2/6)
3rd month 25*(1+rate_percent/200)^(3/6)
4th month 25*(1+rate_percent/200)^(4/6)
5th month 25*(1+rate_percent/200)^(5/6)
6th month 25*(1+rate_percent/200)^(6/6)
then start again with the balance of that end of the prior 6 month period.
Sorry for the length and hope someone finds it useful
The official Savings Bond Calculator has been updated through Nov 2023 last night.