As a follow-up to my previous post on historical inflation (10-year rolling averages), how do periods of high inflation affect safe withdrawal rates for retirement portfolios? I reference a paper about Sustainable Portfolio Withdrawal Rates During High-Inflation Periods by Gerstein Fisher research, but in the middle of writing this post the source document and the entire GersteinFisher.com domain went down. (Update: Here it is on the Wayback Machine. Thanks to reader Peter for the link.)
Planning for the future with 50% stocks and 50% bonds is tricky! The chart below shows how widely a portfolio’s value can vary depending on your start date. The model portfolio is 50% broad US stocks and 50% US bonds. Here’s what $1,000,000 starting in 1929 vs. 1961 vs. 1975 would have performed with a 4% withdrawal rate and 3% annual inflation:
In Exhibit 3, we can see the vast difference a starting year can make, comparing the portfolio values over time of a portfolio where we assume a 4% withdrawal rate and 3% annual inflation but begin in three very different periods. In the worst case, retirement begins in 1929, on the eve of the Great Depression; in 1961, retirement begins in an “average” period with moderate market returns; and in 1975, we have a 30-year period of exceptionally good returns overall, fueled by falling interest rates and by missing the 2008-2009 Global Financial Crisis.
These may be extremes, but they are extremes that happened to real people and could certain happen again.
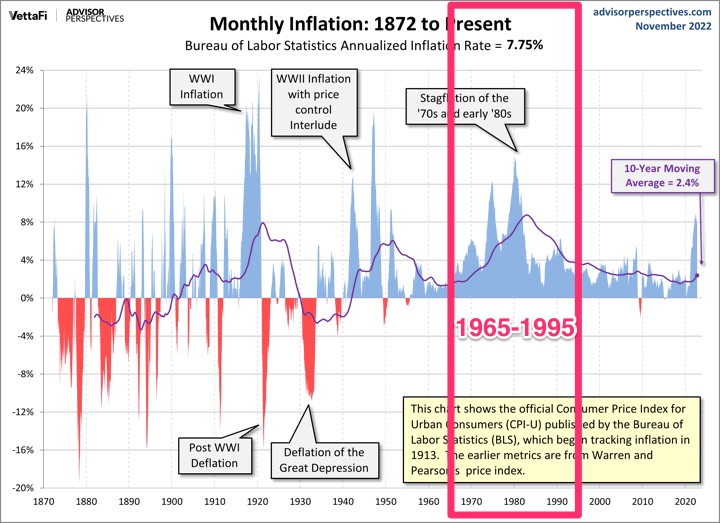
A difference of 1% withdrawal rate can be huge over a 30 year retirement. Here’s the difference between a 3% initial withdrawal rate (then adjusted upwards with inflation) and a 4% initial withdrawal rate (then adjusted upwards with inflation) during a period that contained high inflation (1965-1995). Starting out at withdrawing $30,000 a year on a $1,000,000 portfolio would have been just fine, but withdrawing $40,000 a year would have been disastrous.
To examine what a “worst case scenario” regarding inflation might look like, we examine one of the highest inflation periods in modern US history – a retirement starting in 1966 and ending in 1995, which experienced multiple years of double-digit inflation in the mid- to late-1970s. Even a 4% initial withdrawal rate isn’t sustainable given the rapid increase in inflation (the portfolio is expected to meet an annual withdrawal of nearly $200,000 by the end of the 30-year period), exhausting the portfolio in roughly 25 years.
Here’s the 1965-1995 period highlighted from the historical inflation chart. I noticed that the inflation wasn’t sky-high the entire time, but it was elevated over a long-enough period.
The main takeaway from the paper was that the 4% rule does work most of the time, but watch out for periods of high inflation. Don’t blindly take out 4% a year when inflation is high and your portfolio performance is low. The 4% rule may be something like 95% effective historically, but being flexible with your withdrawals will prevent complete disaster even if you are in the bad luck 5%.
 The Best Credit Card Bonus Offers – 2025
 Big List of Free Stocks from Brokerage Apps
 Best Interest Rates on Cash - 2025
 Free Credit Scores x 3 + Free Credit Monitoring
 Best No Fee 0% APR Balance Transfer Offers
 Little-Known Cellular Data Plans That Can Save Big Money
 How To Haggle Your Cable or Direct TV Bill
 Big List of Free Consumer Data Reports (Credit, Rent, Work)
Ave you tried the wayback machine for the links that died? Maybe heavy traffic, they didn’t want to share
I should have thought of that, I guess I figured CDNs weren’t backed up by Wayback machine.
Used the Wayback machine to locate the source document: https://web.archive.org/web/20220629150509/https://vtew81c5idv4b9bgu3427f4c-wpengine.netdna-ssl.com/wp-content/uploads/2018/04/Gerstein-Fisher-Research-Sustainable-Portfolio-Withdrawal-Rate.pdf.
Nice, thanks! Saved the PDF this time.
There’s a prevailing theory of “Dynamic Spending” that as long as you can adjust your lifestyle or take on part time work and thereby decrease your expenses in down times then your portfolio should last you your lifetime (and conversely during up times).
I am not following Exhibit 3. Is it saying that a $1,000,000 portfolio invested in 1929, but never touched again, has actually gone down in value?? Something seems off with that?
You’re right, now that I have the original paper again, I have added the appropriate details. The chart could have been better labeled. In addition, it seems a bit strange that they assume 3% inflation instead of just using the actual inflation during those time periods.