 Home ownership continues to be a goal for many people, but downpayment requirements also keep rising with housing prices. I previously posted about Unison, which offers downpayment assistance in exchange for a percentage of any future upside (or downside) on your home. Their example states a 40% cut, although it will vary with the size of assistance. Unison also charges an origination fee of 2.5% of the downpayment assistance.
Landed offers a similar shared equity down payment program, but restricted to employees of selected school districts, colleges, and universities in high-cost areas. They also offer up to a 10% downpayment assistance (i.e. $50,000 on a $500,000 home), but they only ask for 25% of future upside (or downside). Instead of charging an origination fee, they ask you to use a real estate agent in their network, who have all agreed to pay Landed part of their commission (0.75% of purchase price). You can use your own agent, but you’d still have to pay that 0.75% fee. That’s a clever trick to avoid any upfront fees.
Here’s another important twist: You must agree to stay with your current employer for at least two years after buying your home. I believe that if you don’t, you will need to pay Landed back within 30 days (even if you don’t sell the home). You may also need a certain amount of time employed with the school. The idea is to improve employee retention in these high-cost areas.
Currently, Landed covers K-12 school districts, colleges, and universities in California (San Francisco Bay Area, Los Angeles Metro Area, and San Diego Metro Area), Colorado (Denver and Boulder metro areas), the state of Hawai?i, and Washington (King County Metro Area). Right now, you can get up to $120,000 in down payment support. They plan on expanding to other high-cost areas including the East Coast.
Unison vs. Landed fee comparison. Let’s say you have a $500,000 house. The Unison numbers are based on the stated example on their website. Unison might provide $50,000 assistance (“co-investment”) and you put in $50,000, and that is the 20% downpayment needed. If the house appreciates by $100,000 and is sold for $600,000, then Unison would get $40,000 of that appreciation (plus their original $50,000 back) and the homeowner would get $60,000. If over time the house doubles in value to $1,000,000, then Unison would keep $200,000 and (plus their original $50,000 back) and the homeowner would keep $300,000 of the gain. The upfront fee would be $1,250 (2.5% of $50,000).
Since Landed only asks for 25% of the upside, the numbers would be $25,000 on a $100,000 gain ($15,000 less than Unison), and $125,000 on a $500,000 gain ($75,000 less than Unison). There is no upfront fee if you use their real estate agent, but Landed will get $3,750 (0.75% of $500,000).
Here’s a separate breakdown example from Landed for a $600,000 home purchase, assuming you sell after 10 years of mortgage payments and either have a $100,000 gain or loss.

I know that some people will scoff at say “who would accept such a bad deal and give up all that home appreciation?”, but for many people the idea of scraping up $50,000 is many times more imaginable than coming up with $100,000. I’m not saying it’s a good idea, but I definitely understand the demand and think these programs will be popular as a result.
It is interesting that both “shared equity” companies have the same basic concept, it’s just the specific implementation that is different. Landed focuses on a group that tends to have stable employment and potentially solid retirement benefits but low base salary. It’s also a group that people want to see living in the neighborhoods that they work in, like firefighters and nurses, and thus can get cheaper funding from non-profit sources. However, this would also mean that if the concept gains traction, there is room for competition to lower the costs for everyone else.
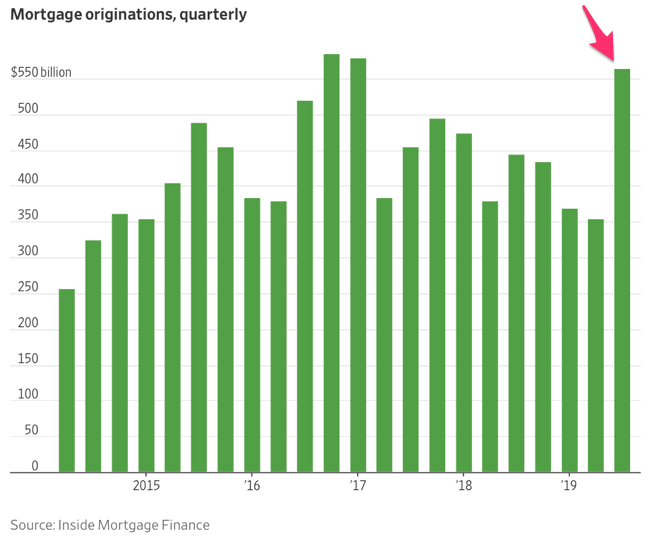
 If you have a mortgage rate above 4%, you should keep an eye on mortgage rates during August to see if there is an opportunity to refinance and save money. (Potential buyers should obviously also take notice, but they were probably paying attention already.) In November 2018, the average 30-year mortgage rate was nearly 5%. In July, the average 30-year mortgage rate was only 3.75%. There are a LOT of outstanding mortgages that become good opportunities for a refinance with even small drops from here. See this chart via


 The Best Credit Card Bonus Offers – 2026
 Big List of Free Stocks from Brokerage Apps
 Best Interest Rates on Cash - 2026
 Free Credit Scores x 3 + Free Credit Monitoring
 Best No Fee 0% APR Balance Transfer Offers
 Little-Known Cellular Data Plans That Can Save Big Money
 How To Haggle Your Cable or Direct TV Bill
 Big List of Free Consumer Data Reports (Credit, Rent, Work)