Here’s my quarterly update on my current investment holdings as of October 2023, including all of our combined 401k/403b/IRAs and taxable brokerage accounts but excluding our primary residence and side portfolio of self-directed investments. Following the concept of skin in the game, the following is not a recommendation, but a sharing of our real-world, imperfect, low-cost, diversified DIY portfolio.
“Never ask anyone for their opinion, forecast, or recommendation. Just ask them what they have in their portfolio.” – Nassim Taleb
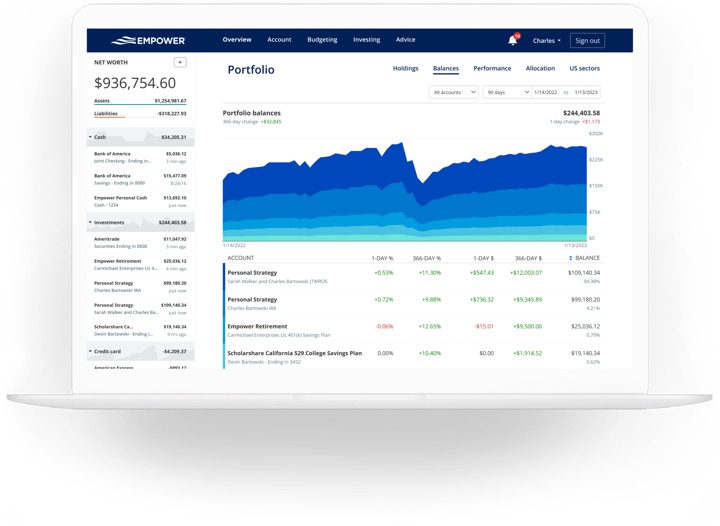
How I Track My Portfolio
Here’s how I track my portfolio across multiple brokers and account types. There are limited free advanced options after Morningstar discontinued free access to their portfolio tracker. I use both Empower Personal Dashboard (previously known as Personal Capital) and a custom Google Spreadsheet to track my investment holdings:
- The Empower Personal Dashboard real-time portfolio tracking tools (free) automatically logs into my different accounts, adds up my various balances, tracks my performance, and calculates my overall asset allocation daily.
- Once a quarter, I also update my manual Google Spreadsheet (free to copy, instructions) because it helps me calculate how much I need in each asset class to rebalance back towards my target asset allocation. I also create a new tab each quarter, so I have an archive of my holdings dating back many years.
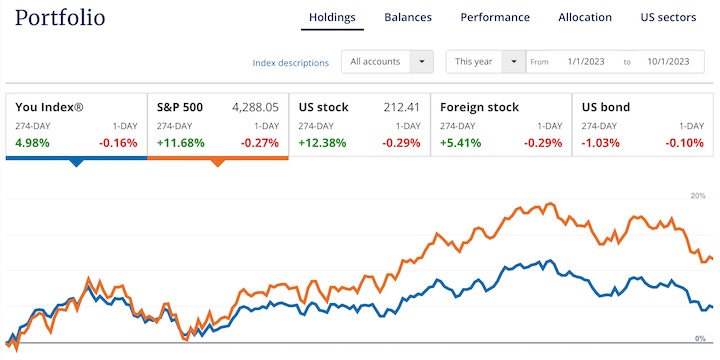
2023 Q2 Asset Allocation and YTD Performance
Here are updated performance and asset allocation charts, per the “Holdings” and “Allocation” tabs of my Empower Personal Dashboard.

Humble Portfolio Background. I call this my “Humble Portfolio” because it accepts the repeated findings that the ability to buy and sell stocks and exceed the performance of basically doing nothing is exceedingly rare. Charlie Munger believes that only 5% of professional money managers have the skill required to consistently beat the index averages after costs.
Instead, by paying minimal costs including management fees, transaction spreads, and tax drag, you can essentially guarantee yourself above-average net performance over time.
I own broad, low-cost exposure to productive assets that will provide long-term returns above inflation, distribute income via dividends and interest, and finally offer some historical tendencies to balance each other out. I have faith in the long-term benefit of owning businesses worldwide, as well as the stability of high-quality US Treasury debt. My stock holdings roughly follow the total world market cap breakdown at roughly 60% US and 40% ex-US. I add just a little “spice” to the broad funds with the inclusion of “small value” ETFs for US, Developed International, and Emerging Markets stocks as well as additional real estate exposure through US REITs.
I strongly believe in the importance of knowing WHY you own something. Every asset class will eventually have a low period, and you must have strong faith during these periods to truly make your money. You have to keep owning and buying more stocks through the stock market crashes. You have to maintain and even buy more rental properties during a housing crunch, etc. A good sign is that if prices drop, you’ll want to buy more of that asset instead of less. I don’t have strong faith in the long-term results of commodities, gold, or bitcoin – so I don’t own them.
I do not spend a lot of time backtesting various model portfolios, as I don’t think picking through the details of the recent past will necessarily create superior future returns. You’ll find that whatever model portfolio is popular in the moment just happens to hold the asset class that has been the hottest recently as well.
Find productive assets that you believe in and understand, and just keep buying them through the ups and downs. Mine may be different than yours.
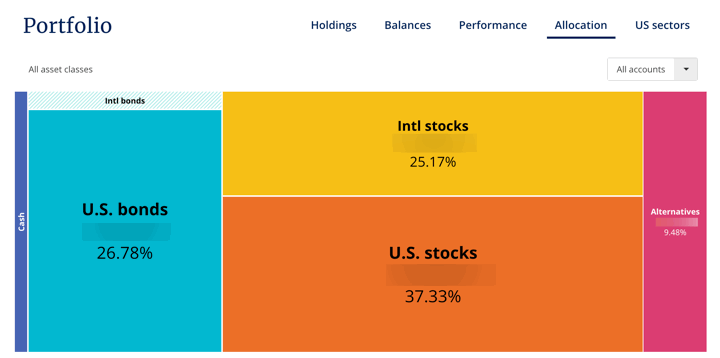
I have settled into a long-term target ratio of roughly 70% stocks and 30% bonds (or 2:1 ratio) within our investment strategy of buy, hold, and occasionally rebalance. My goal is more “perpetual income portfolio” as opposed to the more common “build up a big stash and hope it lasts until I die” portfolio. My target withdrawal rate is 3% or less. Here is a round-number breakdown of my target asset allocation.
- 30% US Total Market (ex. VTI)
- 5% US Small-Cap Value (ex. VBR)
- 20% International Total Market (ex. VXUS)
- 5% International Small-Cap Value (ex. AVDV)
- 10% US Real Estate (REIT) (ex. VWO)
- 15% US Treasury Nominal Bonds or FDIC-insured deposits
- 15% US Treasury Inflation-Protected Bonds (or I Savings Bonds)
Details. According to Empower, my portfolio is up about 5.0% YTD to 10/1/2023. The S&P 500 is up 11.7% YTD, while the US Bond index is down around 1%.
The most notable action this quarter has been… inaction. There was only minor rebalancing via new purchases with cashflows (mostly dividends) this quarter. I haven’t bought any new ETF tickers or sold a single share of anything. I am considering increasing my estimated tax payments to the IRS to compensate for the extra interest being earned on my FDIC-insured savings accounts and Treasury bonds.
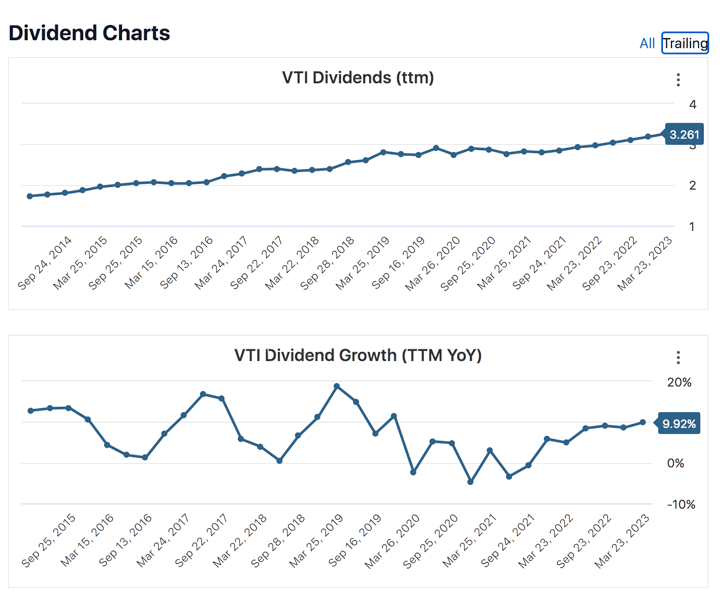
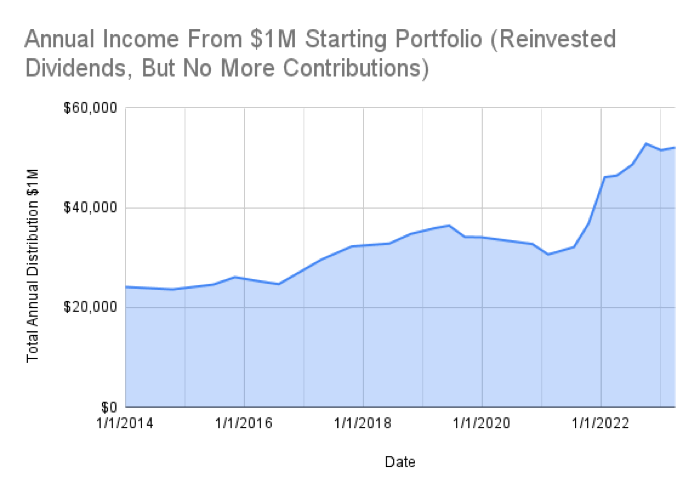
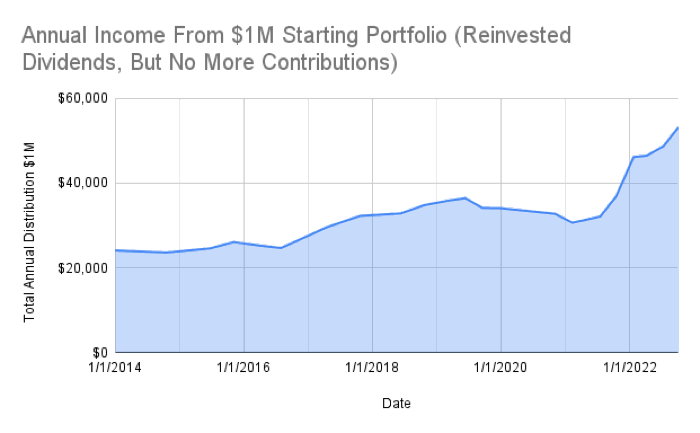
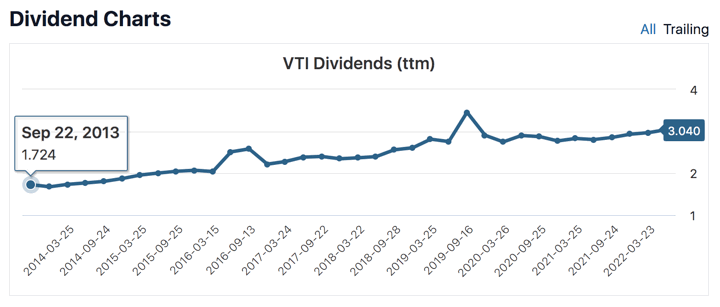
I’ll share about more about the income aspect in a separate post.
 Here’s my 2023 Q2 income update for my


 Here’s my quarterly update on my current investment holdings as of the end of 2022, including our 401k/403b/IRAs and taxable brokerage accounts but excluding real estate and side portfolio of self-directed investments. Following the concept of


 The Best Credit Card Bonus Offers – 2026
 Big List of Free Stocks from Brokerage Apps
 Best Interest Rates on Cash - 2026
 Free Credit Scores x 3 + Free Credit Monitoring
 Best No Fee 0% APR Balance Transfer Offers
 Little-Known Cellular Data Plans That Can Save Big Money
 How To Haggle Your Cable or Direct TV Bill
 Big List of Free Consumer Data Reports (Credit, Rent, Work)