Archives for October 2018

Send $50 Amazon Gift Card Via Text, Get $5 Amazon Credit (Targeted)

Amazon keeps thinking up new ways for folks to send/receive/reload/ingest Amazon gift credits. Which is fine with me, because they’ll usually pay you a few bucks to try it out. Click here to check eligibility for their latest targeted offer: Get a $5 Amazon credit on your next order if you send a $50 Amazon gif card by text message by 12/22/18. If needed, use promo code SMS2018.

Don’t forget that the Discover it card has Amazon.com as a 5% cash back category this quarter, so you might consider using that as your funding source if you don’t have anything better. Otherwise, you’re basically buying a gift card but make sure to choose “Text Message” as the delivery option. Yes, you can send it to yourself if you want. You should see a little grey box when you check out with this text:

Qualifying offers
Thank you for treating someone to an Amazon.com Gift Card. Now we’re treating you to a $5 promotional credit automatically applied to your account, and good for eligible products sold by Amazon.com.

Here’s the offer text:

Surprise someone with an Amazon.com Gift Card sent by text message, and get a $5 promotional code to spend on yourself. Just send at least $50 in Amazon.com Gift Cards by text message and in a single order by December 22, 2018, and receive a $5 promotional credit automatically applied to your account after the qualifying order has shipped. An email notification will also be sent within three (3) days after shipping, confirming your Amazon.com Promotional Credit.

Starbucks App and Chase Pay: Up to 475 Bonus Stars (Targeted)

starbucks

Here is a targeted offer for Starbucks app users. Look on the Starbucks app homepage or inbox for a Chase Pay promotion that says “Reload 3x, Earn 475 Stars.” If you load up your Starbucks account with at least $20 using Chase Pay, you can get 125 bonus stars each time (up to 3 times total). Basically, each $20 load with Chase Pay gets you a $5+ value drink/food award. Ends 12/12/18. Thanks to reader Stephen.

Earn 300 stars and you get Gold status for a year. With Gold status, 125 stars can be redeemed for nearly any food or drink item on the Starbucks menu. Besides a huge Venti caffeine/sugar bomb, most of their lunch food items are over $5 and some are closer to $9. They now have protein boxes, protein bowls, hot/cold sandwiches, and more. Alcoholic beverages are excluded.

Don’t forget that the Chase Freedom card has Chase Pay as a 5% cash back category. You may wish to install the Chase Pay app on Android or iOS. Chase Pay requires you to have an eligible Chase Visa consumer credit card, debit card, or Chase Liquid card.

Frugal Trends: Keep Your iPhone For 3-4 Years + Switch to Cheaper Plan

If you’ve been holding onto that iPhone for longer than you thought you would, you are not alone. According to this WSJ article, the average consumer now waits 2.9 years to upgrade their iPhone (2.8 years for all smartphones).

Horace Dediu runs the numbers independently in Determining The Average Apple Device Lifespan and finds it to have risen to just over 4 years:

These two statistics can both be true as one phone can have multiple owners. The initial owner keeps it for about 3 years and then upgrades to a new phone. Someone else can buy the used phone and get another year or more out of it. Some phones will last longer, while others break prematurely.

Smartphones and data plans add up to thousands of dollars per year. As we see above, the first way to lower your expense is to keep your phone for longer. I think people are noticing that the newer iPhones are certainly better, but by a smaller amount each generation. I’m not as familiar how well this works with cheaper Android phones as you can pick up new Android phone for $200. However, the latest iOS 12 is supposed to speed up old phones, and works all the way back to the iPhone 5S.

The next step is for people to realize that they can bring that “still-good-enough” phone over to a cheaper plan. The WSJ article mentions that carrier turnover is actually lower now than before those big upfront subsidies. People are keeping their old phone but also their old plan – not the same thing! Last year, we saved over a $1,000 with the “secret” Sprint Free Unlimited $0 per month plan after switching from Verizon. Here was our monthly bill for two unlimited lines:

Side note: I’m pretty sure that Sprint is trying hard to boost its numbers before the T-Mobile/Sprint merger is complete. Take advantage of their desperation while it lasts! I don’t think you’ll see this deal after the merger is closed.

Here are more options:

Libby App: Improved Access to Public Library eBook and Audiobooks

Public libraries have offered eBooks for a while, but I stopped using the service because it was too much work. There weren’t that many popular titles available, and finding them was tedious with a waitlist of unknown length. When you did finally get the book, I couldn’t read it on my Kindle and would have to use a clunky third-party Overdrive app. These small hurdles meant that I often wouldn’t finish the book before the due date, upon which the book was unceremoniously yanked back into the cloud.

Happily, I recently discovered the Libby app by Overdrive, which has improved the overall experience dramatically. (Thanks Tom.) You can sign into multiple libraries*. The app is well designed and makes it easier to find titles, and an estimate of the waitlist time is included. Your eBook can be automatically checked out when your turn is up. In addition, there is:

  • Built-in eBook reader that is much improved.
  • Built-in Audiobook player.
  • If allowed, it will send the book to your Kindle device.

Basically, everything can be done within one single app.

This may just be my local library, but the selection also seems to have improved. It’s not perfect as the books seem to come in clusters so it’s hard to read them all in time (I wish there was a defer option to be next in line), but I like that I can at “try” many books for a few chapters and return it earlier if I don’t like it. If I do like it and want a permanent copy (I still prefer to buy physical books), I can buy it on Amazon or the local bookstore.

Bottom line. If you want to try an easier way to borrow free eBooks from your local library, check out the new Libby app.

(* If you join multiple libraries you can expand your access to different ebook/audiobook titles. There are some listed that offer non-residents a library card via mail/online and only charge a nominal fee.)

Will We Ever Talk Openly About Income and Money?

I started sharing my net worth anonymously because it was so hard talk about it publicly. Even today, my site logo is a voice bubble with money inside. Fast forward nearly 15 years later, and it is still unlikely that you know your coworkers’ salaries, let alone their net worth!

Do you know what the average tech worker in Silicon Valley makes? You might be surprised to know that with 5-9 years of experience, the average total compensation is nearly $300,000 per year. I know this from Jackie Luo’s Medium article I Know the Salaries of Thousands of Tech Employees. Luo herself is a software engineer at Square with 3 years of experience, and her base salary is $130,000 with a total annual compensation of about $230,000 (depends on stock price). She asked for anonymous data and compiled the following chart:

Her data reveals that stock grants are a huge part of total compensation (and one that is negotiable). As such, she encourages people to talk about their compensation and create a new culture of openness will help make things more fair. I admit I’m skeptical about that part. You’re fighting against a lot of deeply-ingrained discomfort. Is there any culture on Earth that talks about their wealth (and thus wealth inequality) openly?

I think that the best you can hope for is a trusted, popular website that becomes a huge database of anonymous submissions. I’m not sure any site has reached that level, but the cited ones trying include Glassdoor, Comparably, and Levels. While poking around, I even found a site that compares PhD stipends.

As an aside, this chart also explains why a disproportionate amount of early retirees are tech workers. If you’ve got people making $170,000 right out of college, I don’t care if you do live in the Bay Area, that is still a lot of income. If you have even a small degree of self-awareness, you know that many people live on far less, and that you could too. If you’re a tech couple pulling in $300,000+ a year, financial freedom within 15 years is on the menu. Whether you pick that option or not, that’s up to you.

Consumer Report Car Brand Reliability Rankings 2018

Consumer Reports shared some results from their 2018 Car Reliability Survey in the public articles Who Makes the Most Reliable Cars?, 10 Most Reliable Cars and, 12 Models Lose CR Recommendation Over Car Reliability Issues.

Here’s a partial snapshot of the brand breakdown, which includes the relative change from last year. Highlights:

  • Most reliable: Lexus and Toyota. Again.
  • Most spots improved: Mazda and Acura.
  • Biggest ranking drop: Honda, Chrysler, Volvo, and Tesla.

A partial excerpt with the top rankings are below:

Despite providing these brand rankings, Consumer Reports recommends that you shop by vehicle and not just by brand. Some brands like Toyota and Lexus are reliable across the brand, but others like Honda and Kia have a wide range of rankings by model. In addition, new model redesigns often results in variable reliability. Of course, you’ll need full print or digital access to get those numbers.

My thoughts. In terms of trends, I was disappointed to see Honda slip a bit again in the reliability rankings all the way down to 15th. We’ve said goodbye to our trusty Honda Fit, but I don’t know if we’ll go back to Honda. I bought a Toyota not just due to lower total ownership cost (frugal living), but mostly about avoiding headaches and hassle (simple living).

In terms of methodology, I see a lot of mentions about infotainment issues. Honestly, I now have a car with a big LCD screen, and I never use it. I just stream music, podcasts, and audiobooks from my phone via Bluetooth. Any issue that keeps me from driving the car itself should count 50 times more than a slow or frozen screen.

Chase Bank Bonus: $600 Total Checking + Savings, 60,000 Point Upgrade to Sapphire Banking

Chase Bank has updated banking promotions for new customers without a Chase Bank account (closed more than 90 days ago and haven’t gotten a bonus in the last 2 years). The first bonus is for their Total Checking and Savings accounts, and if you satisfy that and have a Sapphire credit card, you can upgrade to the Sapphire Banking with higher requirements.

  • Up to $600 for opening a new Total Checking + Savings account. You must move over a direct deposit on the new checking account ($300 bonus), and/or deposit and maintain $15,000 in the savings account for 90 days ($200). Do both, and get another $100, for $600 total. The easiest way to avoid monthly fee is to keep $1,500 in Total Checking and $300 in Savings.
  • 60,000 Ultimate Rewards points for upgrading to a Chase Sapphire bank account. Got a Chase bank account and a Sapphire credit card? They want your business, so take a look at their upgrade offer to Sapphire Banking. You must move over $75,000 in assets (bank deposits or securities) to Chase Bank or Chase You Invest brokerage. You can simply move over some existing stocks, ETFs, or mutual funds via ACAT transfer and your tax cost basis should transfer. Alternatively, you could buy US Treasury bills in the brokerage account as an alternative to Chase Bank’s sad interest rates. You need to also have the Chase Sapphire Preferred or Chase Sapphire Reserve credit card.

Together, this could be up to $1,500 total value. If you have the Chase Sapphire Reserve card, the 60,000 points are worth $900 towards travel (or 60,000 airline miles). $900 airfare/hotel/car rental value + $600 cash = $1,500. If you have the Chase Sapphire Preferred card, the 60,000 points are worth $750 towards travel (or 60,000 airline miles).

Here are previous posts on the Chase Total Checking bonus and Chase Sapphire Banking bonus with more details.

Household Equity Ownership Percentage vs. Future Stock Market Returns

Below is a chart that tracks two simple numbers over the years, each with their own vertical scale (click to enlarge):

  • The average household’s equity ownership share, as a percentage of total equity and credit (bond) assets. (Left-axis)
  • The subsequent 10-year average annual return of the S&P 500 index. (Right-axis)

Kind of eery, right? As the relative demand for stocks goes up, their future return goes down. This is the most up-to-date version of the chart that I’ve seen – credit @TihoBrkan via Abnormal Returns. The first time I recall seeing this chart was 5 years ago in this in-depth Philosophical Economics article.

Since then, this 2016 academic paper by Yang and Zhang found that “Household Equity Share” was a better predictive tool than the CAPE or PE10 ratio. Most recently, OfDollarsandData had a thoughtful piece on why using this correlation to time the market would be very difficult (you’d have to be out of the market for a long time, and during some great bull markets). Here’s another way to show this relationship:

(I’m not sure the x-axis labels on this last chart are correct, as it doesn’t agree with the first chart that tops out at 55% household equity share.)

This will be an interesting chart to track over time. Overall, it is yet another indicator that points to the average return of US stocks for the next 10 years to be rather muted (in the low single digits!). But again, anything could happen – both higher or lower – in the short-term.

Bond Market Risks: Keeping It Short, Simple, and Safe

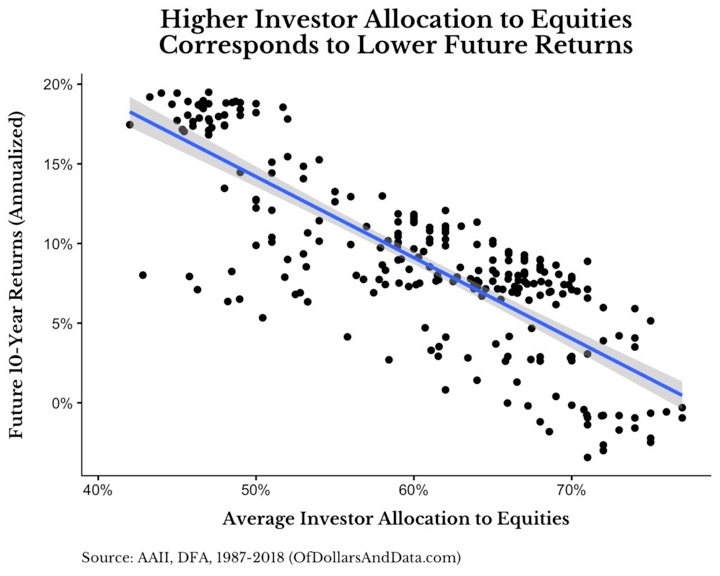
A recurring theme in my asset allocation philosophy is to stick with simple and safe bonds in your portfolio. The problem is, there will be other bonds that outperform safe, shorter-term US Treasury bonds and you might start to question your decision. I try to remind myself to consider how they fit into your entire portfolio. I would rather take on risk with stocks due to their big upside potential and use bonds for stability in times of stress.

Here is an older WSJ article The Case for Minimizing Risk in Your Bond Holdings by William Bernstein on the subject. If you run into a paywall, I discuss the article here.

Recently, there have been more articles about the riskier bond options out there.

Corporate bonds – hidden risks? Credit ratings agencies continue to have the conflict of interest where they are paid by the bond issuers themselves – remember the financial crisis and those AAA-rated subprime bonds? These days, companies are loading up on debt, but they still really really really want their bonds to be rated as “investment-grade”. More than 50% of the corporate bond market is now rated BBB, just barely “investment grade” as opposed to “junk”, according to the Bloomberg article A $1 Trillion Powder Keg Threatens the Corporate Bond Market:

That’s a lot of borderline debt that will eventually have to be refinanced at higher rates.

Actively-managed bond funds – what’s really inside? In addition, I recommend reading this Forbes interview with bond manager Jeffrey Gundlach: The Bond King Speaks: Doubleline CEO Jeffrey Gundlach Offers His Best Investing Advice. There are many interesting insights, and here are some excerpts on bond index funds and the active bond fund competition:

On the fixed-income side, active bond managers have by and large outperformed the intermediate-term bond benchmark, the Barclays Bloomberg Aggregate Bond Index (the “Agg”).

What helps the active manager to outperform the index is that it’s quite possible in bonds to do things very differently from what’s in the traditional bond indexes. The Agg has no foreign bonds, certainly no emerging markets bonds, no below-investment-grade bonds, no bank loans, no structured finance to speak of like ABS or CMBS, all of which are viable asset classes. But the index doesn’t include them. Active bond managers can buy these things and increasingly over the last couple of decades have done so.

Active funds are being measured against an investment-grade U.S.-only index. The active funds can own tons of emerging markets, junk bonds, bank loans — some of them even own 10 or 15% equities. Obviously, if a manager is allowed to own equities against the bond index in a world where bond returns over the last two years are nearly zero on a total return basis, you can see there’s a lot of ways that bond managers can game an index more than a stock manager.

Is a stock manager really going to measure themselves against the S&P 500 and own 50% bonds? I doubt it. The industry’s evolved in a way that has given us an advantage.

That’s probably going to turn into the opposite soon, where these activities outside of the boundaries of U.S.-only, intermediate-grade only bonds will start hurting. Junk bonds are getting crushed. Investment-grade corporate bonds are doing horribly over the last year. Typically, these are systematically overweighted by the majority of active bond managers. Not us, not Doubleline.

You could categorize the industry fairly accurately with a broad stroke by saying most firms are perpetually overweight corporate credit, underweight treasuries and they even have some stocks with below-investment-grade ratings. When you get to a world where the lower quality material like junk bonds or emerging markets are starting to come under stress due to falling equity prices, and perhaps a slowing global economy, well, suddenly, these games that are often played don’t help.

As noted recently, Total Bond ETFs that track the AGG index have 60-80% of their holdings that are backed by the US government, and the rest are investment grade US corporate bonds. Overall it is mostly high-quality stuff. Meanwhile, an actively-managed bond fund can include riskier corporate bonds, complex asset-based securities, or bonds from Emerging Markets countries with much higher yields. Basically, bond managers can take on a lot of extra risk and get paid for it while the party lasts. This will make them look like they are beating the AGG benchmark, while their holdings are nothing like the benchmark.

With actively-managed bond funds, it’s always a question of the manager adding enough value to compensate for the higher expenses. Bill Gross used the be “Bond King”. Now it’s Gundlach. Maybe Gundlach will continue to successfully time his purchases in and out of various bonds. I choose not to depend on a specific manager’s skill. Instead, I stick with US Treasury bonds, investment-grade municipal bonds from a conservative bond manager, or FDIC-insured bank certificates of deposit for the bond portion of my portfolio.

My Money Blog Portfolio Income – October 2018

dividendmono225

For a young person making a plan to reach financial independence at a very early age (under 50), I think using a 3% withdrawal rate is a reasonable rule of thumb. For someone retiring at a more traditional age (closer to 65), I think 4% is a reasonable rule of thumb. However, life is less stressful when you are spending just the dividends and interest generated by your portfolio. The analogy I fall back on is owning a rental property. If you are reliably getting rent checks that increase with inflation, you can sit back calmly and ignore what the house might sell for on the open market.

Therefore, I track the “TTM Yield” or “12 Mo. Yield” from Morningstar, which the sum of a fund’s total trailing 12-month interest and dividend payments divided by the last month’s ending share price (NAV) plus any capital gains distributed over the same period. (Index funds have low turnover and thus little in capital gains.) I like this measure because it is based on historical distributions and not a forecast. Below is a very close approximation of my portfolio (2/3rd stocks and 1/3rd bonds).

Asset Class / Fund % of Portfolio Trailing 12-Month Yield (Taken 10/21/18) Yield Contribution
US Total Stock
Vanguard Total Stock Market Fund (VTI, VTSAX)
25% 1.71% 0.43%
US Small Value
Vanguard Small-Cap Value ETF (VBR)
5% 1.96% 0.10%
International Total Stock
Vanguard Total International Stock Market Fund (VXUS, VTIAX)
25% 2.86% 0.72%
Emerging Markets
Vanguard Emerging Markets ETF (VWO)
5% 2.56% 0.13%
US Real Estate
Vanguard REIT Index Fund (VNQ, VGSLX)
6% 4.30% 0.26%
Intermediate-Term High Quality Bonds
Vanguard Intermediate-Term Tax-Exempt Fund (VWIUX)
17% 2.90% 0.49%
Inflation-Linked Treasury Bonds
Vanguard Inflation-Protected Securities Fund (VAIPX)
17% 3.30% 0.56%
Totals 100% 2.69%


The 2.7% trailing income yield is up slightly than in recent updates, mostly due to increased bond interest. The fact that interest rates are now reliably above inflation across the yield curve is good in my opinion, even if it means some of my bond prices drop. The relative contribution of US stocks is down, as US stock prices are slightly up. The relative contribution of International stocks is up, as International stock prices are down. In this way, tracking yield adjusts in a very rough manner for valuation.

We are a real 40-year-old couple with three young kids, and this money has to last us a lifetime (without stomach ulcers). This number does not dictate how much we actually spend every year, but it gives me an idea of how comfortable I am with our withdrawal rate. We spend less than this amount now, but I like to plan for the worst while hoping for the best. If we both lose our jobs, we should have manageable expenses such that we still won’t need to spend more than 2.7% to 3%. For now, we are quite fortunate to be able to do work that is meaningful to us, in an amount where we still enjoy it and don’t get burned out.

Life is not a Monte Carlo simulation, and you need a plan to ride out the rough times. Even if you run a bunch of numbers looking back to 1920 and it tells you some number is “safe”, that’s still trying to use 100 years of history to forecast 50 years into the future. Michael Pollan says that you can sum up his eating advice as “Eat food, not too much, mostly plants.” You can sum up my thoughts on portfolio income as “Spend mostly dividends and interest. Don’t eat too much principal.”

TopCashBack Existing User Promo: Free Fall-Themed Dish Towel ($2.99 Value)

If you shop at Target stores and are an existing TopCashBack portal member, grab a free $2.99 Thanksgiving Dish Towel at this link. Offer expires Sunday, October 21st at 11:59pm PST. Instructions:

1) Simply click the “Get Offer” button to go to the Target website.
2) Purchase any $2.99 Select Threshold Kitchen Towels then shop as normal.
3) Within 7 days of purchase, you’ll see the transaction in your TopCashback account
4) Once confirmed, your transaction will become payable within 14 days.

Not worth a special trip, but free is free. You will have 7 days to pick it up after order confirmation. I also see an optional button online to extend pickup for an additional day past that. If a specific towel design is not in stock at your location, try another one. TopCashBack likes to offer little freebies to all existing users now and then to keep us aware of their service.

My Money Blog Portfolio Asset Allocation, October 2018

portpie_blank200

Here’s my quarterly portfolio update for Q3 2018. These are my real-world holdings and includes 401k/403b/IRAs and taxable brokerage accounts but excludes our house, cash reserves, and a few side investments. The goal of this portfolio is to create enough income to cover our household expenses. As of 2018, we are “semi-retired” and have started spending some dividends and interest from this portfolio.

Actual Asset Allocation and Holdings

I use both Personal Capital and a custom Google Spreadsheet to track my investment holdings. The Personal Capital financial tracking app (free, my review) automatically logs into my accounts, tracks my balances, calculates my performance, and gives me a rough asset allocation. I still use my custom Rebalancing Spreadsheet (free, instructions) because it tells me exactly how much I need in each asset class to rebalance back towards my target asset allocation.

Here is my portfolio performance for the year and rough asset allocation (real estate is under alternatives), according to Personal Capital:

Here is my more specific asset allocation broken down into a stocks-only pie chart and a bonds-only pie chart, according to my custom spreadsheet:

Stock Holdings
Vanguard Total Stock Market Fund (VTI, VTSMX, VTSAX)
Vanguard Total International Stock Market Fund (VXUS, VGTSX, VTIAX)
WisdomTree SmallCap Dividend ETF (DES)
Vanguard Small Value ETF (VBR)
Vanguard Emerging Markets ETF (VWO)
Vanguard REIT Index Fund (VNQ, VGSIX, VGSLX)

Bond Holdings
Vanguard Limited-Term Tax-Exempt Fund (VMLTX, VMLUX)
Vanguard Intermediate-Term Tax-Exempt Fund (VWITX, VWIUX)
Vanguard Intermediate-Term Treasury Fund (VFITX, VFIUX)
Vanguard Inflation-Protected Securities Fund (VIPSX, VAIPX)
iShares Barclays TIPS Bond ETF (TIP)
Individual TIPS securities
U.S. Savings Bonds (Series I)

Target Asset Allocation. Our overall goal is to include asset classes that will provide long-term returns above inflation, distribute income via dividends and interest, and finally offer some historical tendencies to balance each other out. I personally believe that US Small Value and Emerging Markets will have higher future long-term returns (along with some higher volatility) than US Large/Total and International Large/Total, although I could be wrong. I don’t hold commodities, gold, or bitcoin as they don’t provide any income and I don’t believe they’ll outpace inflation significantly.

I believe that it is important to imagine an asset class doing poorly for a long time, with bad news constantly surrounding it, and only hold the ones where you still think you can maintain faith.

Stocks Breakdown

  • 38% US Total Market
  • 7% US Small-Cap Value
  • 38% International Total Market
  • 7% Emerging Markets
  • 10% US Real Estate (REIT)

Bonds Breakdown

  • 50% High-quality, Intermediate-Term Bonds
  • 50% US Treasury Inflation-Protected Bonds

I have settled into a long-term target ratio of 67% stocks and 33% bonds (2:1 ratio) within our investment strategy of buy, hold, and occasionally rebalance. With a self-managed, simple portfolio of low-cost funds, we minimize management fees, commissions, and taxes.

Holdings commentary. On the bond side, as Treasury rates have risen, last quarter I sold my shares of Vanguard High-Yield Tax Exempt and replaced it with Vanguard Intermediate-Term Treasury. I liked the slightly higher yield of that (still pretty high quality) muni fund, but as I settle into semi-retirement mode, I don’t want to worry about the potential of state pension obligations making the muni market volatile. In addition, my tax bracket is lower now and the Federal tax-exempt benefits of muni bonds relatively to the state tax-exempt benefit of Treasury bonds is much smaller now. On a very high level, my bond portfolio is about 1/3rd muni bonds, 1/3rd treasury bonds, and 1/3rd inflation-linked treasury bonds (and savings bonds). These are all investment-grade and either short or intermediate term (average duration of 6 years or less).

No real changes on the stocks side. I know that US stocks have higher valuations, but that’s something that is already taken into account with my investment plan as I own businesses from around the world and US stocks are only about 30% of my total portfolio. I have been buying more shares of the Emerging Markets index fund as part of my rebalancing with new dividends and interest. I am considering tax-loss harvesting some older shares with unrealized losses against another Emerging Markets ETF.

The stock/bond split is currently at 68% stocks/32% bonds. Once a quarter, I reinvest any accumulated dividends and interest that were not spent. I don’t use automatic dividend reinvestment.

Performance commentary. According to Personal Capital, my portfolio now slightly down in 2018 (-2.7% YTD). I see that during the same period the S&P 500 has gained 5% (excludes dividends), Foreign (EAFA?) stocks are down 8.2%, and the US Aggregate bond index is down 2.4%. My portfolio is relatively heavy in international stocks which have done worse than US stocks so far this year.

An alternative benchmark for my portfolio is 50% Vanguard LifeStrategy Growth Fund (VASGX) and 50% Vanguard LifeStrategy Moderate Growth Fund (VSMGX), one is 60/40 and one is 80/20 so it also works out to 70% stocks and 30% bonds. That benchmark would have a total return of +0.07% YTD (as of 10/16/18).

I’ll share about more about the income aspect in a separate post.