The term “Safe Withdrawal Rate” (SWR) usually refers to the amount of your portfolio that you can withdraw each year in retirement safely without running out of money. The “4% rule” is often used, which says that if you want $40,000 inflation-adjusted every year safely , you need $1 million as your target.
Reader Dave thoughtfully sent me an interesting Financial Advisor magazine article about an upcoming academic paper by Dr. Wade Pfau that takes a look at this from another angle. What if you wanted to figure out a “Safe Savings Rate”?
Let’s say you save for 30 years, and then retire (spend) for 30 years. The traditional SWR only depends on the 30-year period when you are saving reach that target number. Instead, what if you looked at the entire 60 year period together. This ends up smoothing things out, because periods of high return are often followed by periods of low return, and vice versa.
Here are the baseline assumptions. The goal is to withdraw 50% of current salary, inflation-adjusted, during retirement. You maintain a constant asset allocation of 60% stocks and 40% bonds (T-Bills). Results are in the chart below. The blue line is the saving rate according to the 4% rule, and the black line is based on the new 60-year test period using actual investment returns.
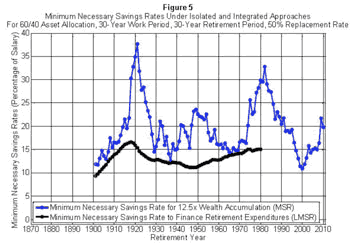
Based on market data since 1871, a savings rate of 16.62% would have worked every time. As you can see the black line is also much more consistent over time. Can everyone manage that? Maybe not, but few people are satisfying the 4% rule as well.
The given scenario is not one-size-fits-all, but it would be interesting if this research was expanded into some sort of retirement calculator. For example, all other things held the same, if you saved for 40 years, the safe saving rate drops to 8.77%. If you saved for only 20 years, the safe saving rate rises to over 30%. I’ll have to wait for the published paper to see what happens if you go a bit riskier into say 80% stocks/20% bonds, or if it accounts for changing allocations over time.
Update: Here is a link to the working paper [PDF].
 The Best Credit Card Bonus Offers – 2025
 Big List of Free Stocks from Brokerage Apps
 Best Interest Rates on Cash - 2025
 Free Credit Scores x 3 + Free Credit Monitoring
 Best No Fee 0% APR Balance Transfer Offers
 Little-Known Cellular Data Plans That Can Save Big Money
 How To Haggle Your Cable or Direct TV Bill
 Big List of Free Consumer Data Reports (Credit, Rent, Work)
Hi Jonathan:
I’m a subscriber to your blog in Google Reader, and I was quite happy/pleased to see this blog post, because I am the author of the research article you are describing. The full research article will be in the May 2011 Journal of Financial Planning. Dan Moisand wrote a great description of the article (that is what you are linking to here). If anyone is interested to read the full research article, I have a revised working paper version in PDF available to download from:
http://mpra.ub.uni-muenchen.de/29599/
Thanks, Wade
Instead of investing in stocks/bonds for retirement, I believe it is better say to invest $2,000/year and open up websites. Most young millionaires these days are rich because of their website. I think the potential return outweighs the risk.
around Xmas time, you posted a link by Jim Otar. Where he talks about the decumulation phase, and how changes to inflation and the markets in the first few years can really derail your retirement savings.
https://www.mymoneyblog.com/free-pdf-of-unveiling-the-retirement-myth-by-jim-otar.html
i didnt see in the article if Pfau used an average inflation rate or a varying rate
it wasn’t explicitly stated in the link, but it sounds like this is 16% of gross pay.
So for a couple making $200,000 (gross) this would indicate that a savings rate of $32,000/yr would do the ‘trick’ (start working at 30, retire at 60, die at 90, 60/40 AA).
This of course assume that the couple’s salary tracks inflation, and thus so do their savings (at 3%/yr inflation, that couple earning $200k at 30 yo needs to save 32k in 2011, and should theoretically be earning more than 500k in 2041 dollars, thereby necessitating a savings rate of $80k/yr in 2041). This is a HUGE assumption. While many people do experience wage growth tat tracks core CPI or CPI-U, many have long periods of time where their salaries lag inflation for years on end. The result is that the saver needs to increase the savings rate to make up for the ‘inflation adjustment shortfall.’
To be honest, a couple earning $200k, even with 2 children, should find it very easy to put $16.5k each in their 401ks (33k/yr). In theory that would give them the 100k they need, nflation adjusted, for their 30 years of retirement. Unfortunately, wage growth may lag inflation, and thus this plan gets blown to smithereens.
Moreover, for a couple earning $100k, especially with 2 children, saving $16k/yr is not easy, and data has shown that this group of earners has seen their wages lag inflation severely over the past 20+ years. A double whammy, and one of the real causes of income inequality in real terms) in the U.S., and a hige cause for concern.
I’m assuming this study did not take into account Social Security…?
This is a fantastic paper… can’t wait to read the full thing. I’ve always been on the cautious side and put over 25% of my income into my long-term portfolio, so it’s good to see that’s above and beyond what’s required.
@Wade Pfau – Thanks for the visit and for the link! Look forward to reading it.
Nice article.
I’ve often heard 10% or 15% cited as good goals, but never seen anything to back up those numbers. Good to have something concrete to put behind a savings rate goal.
Nuri:I use rolling periods from the historical data, which means I am using varying rates rather than average rates. 1918 turned out to be the worst case retirment year due to its combination of asset returns and inflation rates.
enonymous: Yes, it is gross pay. And the rest of your comments get at an essential point: 16.62% is not a universal safe savings rate like the 4% safe withdrawal rate rule. Everyone will have a different safe savings rate depending on their personal circumstances. Social Security will be added on top. Social Security contributions are not part of the 16.62%, and also Social Security benefits go on top of the 50% replacement rate.
Thanks!
I think basing your strategy on past returns is like whistling past the graveyard. Unfortunately, it is the only strategy that makes sense for a large percentage of the middle-class.
One appeal of the stock and bond markets is that they are no-brainers; make you bets and let ’em ride! It’s all a crap-shoot.
According to MSN Money, however, the real long-term average return of the stock market is 1.4% when you factor in how people invest in the real world based on our common human frailties.
We tend to panic and get greedy. These emotions result in our buying when we see prices rising and selling when prices are falling. In other words, most middle-class investors tend to jump in and out of the market at exactly the wrong times.
And there have been three 20 year periods when the actual return was just 0.7 percent. If you plan to retire after one of those periods, think again!
The link to the working copy of the paper is not working for me. Is it still valid?
Thank you for your interest, dillard.
The link is valid, but lately that website has been down a lot. Hopefully it will be back up again soon.
I do also have a summary of the paper on my blog which includes most of the figures from the paper.
http://wpfau.blogspot.com/2011/02/safe-savings-rates-new-approach-to.html
Thanks, Wade