Archives for June 2018

Reminder: Don’t Put Too Much Employer Stock Into Your 401(k)

Every time a large corporation stumbles, you will see something along these lines: Having Too Much Employer Stock in Your 401(k) Is Dangerous. That doesn’t prevent it from being solid advice. The best advice bears repeating.

Why? If your retirement savings are heavily concentrated in your employer stock, you human capital and your investment capital are directly linked. If your company falters, then you can lose both your job and your retirement security. Past examples include Enron, MCI Worldcom, and Tyco. Remember that any individual stock can go to zero.

In a large, multinational corporation, even a mid-level executive simply won’t affect the bottom line that much. You could be doing a great job, but what if the top brass commits fraud, takes on too much debt, or otherwise mismanages the company.

This time around, it is General Electric (GE). Per Morningstar data, $100,000 invested in GE stock on January 1st, 2017 would be about $47,000 today. Over the same period, $100,000 invested in a S&P 500 index fund would be about $124,000. That’s a gap of over $75,000 on a starting balance of $100,000. GE may recover eventually, but even that won’t help a retiree who needs the money now.

The Fortune article provides a list of other large company 401(k) plans that have heavy allocations to their own stock. Some of these are highly-respected companies, but then again so was GE.

  • Sherwin Williams (62%)
  • Colgate Palmolive (56%)
  • Exxon Mobil (54%)
  • Lowe’s Home Improvement (50%)
  • PACCAR (50%)
  • Dillard’s Department Stores (48%)
  • Chevron (44%)
  • McDonalds (39%)
  • Costco (38%)
  • Cerner (37%)

In my opinion, things are different if you are a majority owner of a small, private business. Yes, you also have a lot of eggs in one basket, but you directly control that basket! In addition, your upside could be much, much greater.

Consider that Vanguard charges money for financial advice through their Vanguard Managed Account Program (VMAP). When they analyzed the before-and-after results from actual participants, they found that their biggest impact was simply helping people reduce their exposure to company stock. They found that 12% of participants initially had a concentrated position of 20% or more in employer stock.

If you’re reading this, you can implement this advice for free! Do not invest more than 10% of your 401(k) plan in company stock. Consider reallocating funds into a low-cost, diversified index fund or other similar alternative. (Companies themselves are not allowed to exceed 10% in company stock for pension plans.)

Amazon Prime + Whole Foods Additional 10% Off Discounts Now Nationwide

Amazon Prime members are now able to get an additional 10% off on “hundreds” of Whole Foods sale items at locations nationwide. Look for the yellow sign below. They had been rolling this out gradually, but it is now nationwide as of 6/27/18. There will also be other discounts marked as “Prime member deals” with a blue sign.

In order to get your discount, you must either show a barcode from your Whole Foods smartphone app at checkout (with your Prime info linked), or enter your phone after linking it at amazon.com/primesavings. Linking my phone number took me 10 seconds, so this option seems like a much more reliable method.

Stack with the 5% back at Whole Foods and Amazon.com with the Amazon Prime Rewards credit card.

Other perks? If you live in a major metro area, check if Whole Foods now offers free 2-hour food delivery to your house. Many locations have also installed special Amazon lockers to let you pick up packages. It will be interesting to see how this acquisition continues to evolve.

You can get a free 30-day trial of Amazon Prime here.

US Housing Market Breakdown Chart

I don’t have any clever observations to share along with it, but the WSJ Daily Shot shared an interesting breakdown of the US housing market. Occupied or Vacant, Owned or Rented, Mortgage or Not, Negative Equity or Not, Foreclosure or Not, and so on.

There was also a chart of the historical rate of mortgage foreclosures.

Evicted: Low-Income Tenants and Landlord Economics in Milwaukee

evicted_coverEvicted: Poverty and Profit in the American City by Matthew Desmond follows eight different families who struggled to pay rent in poor areas of Milwaukee, Wisconsin. Around the time of the 2008 financial crisis, the author lived in the same units as the other tenants and rented from the same two landlords, whom he also profiles in vivid detail. Amongst many other major awards, this book won a 2017 Pulitzer Prize.

The eviction cycle. Imagine that you are either in a low-paying job or receive government benefits, but that income isn’t enough to pay for rent, utilities, and food. So in any given month, one of those bills doesn’t get paid. That means eventually you get behind on rent, and eventually you get evicted.

After you are evicted once, your housing options instantly shrink. (Not many landlords want to rent to someone who just got evicted.) Just as payday loans specifically target folks with no other borrowing options, there is a subset of housing units that target folks with evictions. You may be surprised that the units in the poorest neighborhoods can cost just as much as a nicer unit in a better neighborhood (that does background checks). As with payday loans, you could argue lenders need to charge higher interest rates to cover more frequent defaults. You could similarly argue that landlords in low-income areas need to charge higher rents to cover unpaid rent and higher turnover costs.

After some time in shelters or crashing with relatives, you scrape together enough to make first month’s rent and a deposit. But every month, rent again takes up 70% of your income (ex. $500 rent and $700 to $800 income), so eventually you fall behind again. The sink gets clogged. Now, the landlord doesn’t want to pay a plumber $100 an hour when you are already owe them two months of back rent. But if your landlord doesnt’t fix the sink, you’re not going to treat the apartment nicely either. You’re also not going to pay any more rent. Two wrongs don’t make a right, but they do save both sides money (in the short-term). Your next eviction is only a matter of time, and cycle repeats.

Stable housing forms the core of a good community. Forced moves can hurt your employment prospects as you miss work while searching for housing. Forced moves lead to increased student absences or having to move schools entirely. Forced moves cause people to lose valuable property like furniture, appliances, clothing, and other household items.

Landlord economics. I didn’t see that much landlord “profit” when my rough calculations showed they were basically two people working full-time in a highly-leveraged business. Yes, landlords Sherrena and her husband “owned” 36 units and brought in $120,000 in gross rent annually, but that is before paying the mortgage, taxes, maintenance, and the time spent as full-time property managers. There was a constant flow of finding new tenants, fixing up damaged units, collecting partial rent payments when possible, and evicting those who fell too far behind. Every missed rent check was $500 less out of their monthly income. An Amazon reviewer stated that he followed up on the properties and found that by 2016 Sherrena no longer owned any of them (many went into foreclosure). I happened to invest $2,000 into an investor loan backed by an 6-plex in Milwaukee and it also went into foreclosure. I’m sure there are landlords doing fine, but I wouldn’t describe it as “easy profits”.

The mobile home park was a bit different. This seems to be a weird loophole where technically you are only renting a plot of land and a utility connection. The “mobile” home (which never moves) on the concrete pad is simply given free to the tenant, who then assumes the responsibility of maintaining everything inside. The landlord doesn’t have to worry about plumbing, electrical, heat, roofing, and so on. If you get evicted, you can’t afford to move your “free” home, and it gets handed off to the next tenant.

Housing assistance statistics. In 2012, 1 in 9 occupied rental households in Cleveland and 1 in 14 in Chicago were summoned to eviction court. Having an eviction can subsequently disqualify you from future public housing assistance, which led the Pulitzer committee to call this book a “deeply researched exposé that showed how mass evictions after the 2008 economic crash were less a consequence than a cause of poverty.” Here are some statistics from the book:

  • 1% of poor renters live in rent-controlled units.
  • 15% of poor renters live in public housing.
  • 17% of poor renters receive a government subsidy (rent-reducing voucher).
  • 67% of poor renters receive no federal housing assistance.

In addition to the 2/3rd of poor renters with no federal housing assistance, another of the book’s arguments is that existing housing assistance programs simply don’t do enough to help people back on their feet. It’s like if you have a broken leg and you need eyeglasses. You need both fixed to get back to work, but you are only given enough money to solve one of the problems. Even if I give you a cast, you’re still blind. If I only give you eyeglasses, you still can’t walk. Money is being spent right now, but people are still stuck in the same place as before. Perhaps more money upfront would help people get back firmly on their feet.

The author’s proposed solution is to signficiantly expand the existing housing voucher program where every family below a certain income level would be eligible for a housing voucher. The voucher could be used to pay for rent on the open market (but not too luxurious or unsafe), similar to how food stamps work. He proposes a variety of sources for the money, for example getting rid of the mortgage interest deduction.

This book reminded me of Nickel and Dimed by Barbara Ehrenreich from over a decade ago. (Here is her NYT review of this book.) Yes, bad decisions can play a role but however you arrive, it is exceptionally hard to break out of the cycle of poverty. You are sensitive to any small setback (car repair, medical bill, theft). Many things actually end up being more expensive when you are broke. Hard work is necessary but not sufficient. You need either a big dose of help (family, friends) or a long streak of avoiding bad luck.

The storytelling in this book is what stays with you. Out of all the families profiled in the book, the only ones that eventually broke the cycle got help from family. That way, they could get everything together long enough to and either land a stable job or finish education/training. The author’s solution is essentially to have the government do that same thing, but the question is whether fellow Americans (strangers) want to help out in the same way (higher taxes). I don’t know about that.

Social Security Trust Fund: Income vs. Expenses

You may have read recently that the Social Security Trust Fund is starting to shrink, and that it is projected to run out of money in 16 years. (Medicare’s trust fund is projected to run out in 8.) This is not the same thing as Social Security itself running out of money, as most Social Security payments to retirees come from the payroll taxes paid by current workers. As the NY Times points out:

…tax collections would be sufficient to pay about three-fourths of promised Social Security benefits for 75 years.

Of course, a 25% cut is still going to be extremely painful for a lot of people. However, I don’t expect any changes soon. As the WSJ Daily Shot points out, Social Security has had a cash deficit each year since 2009. (More was being paid out in benefits than was taken in by payroll taxes.) The deficit was simply masked by interest earned on the fund until recently:

“Fixing” this problem is going to hurt somebody in the pocketbook – either younger workers or retirees, probably both. That means no politician is going to do anything about it unless there is no other option. The following chart of income vs. expenses suggests that about 2030, the trust fund will be nearly depleted and the rate of depletion will be quite fast.

So that’s my prediction. All talk and no action until 2030.

Retirement Nest Egg Calculators: Running Out of Money vs. Running Out of Time

If you have researched retirement at all (early or otherwise), you’ve probably ran across various retirement calculators online. You input how much money you have (or plan to have), your asset allocation, and it spits out some numbers. This Vanguard Retirement Nest Egg Calculator is a good example of a simple version.

Let’s try an example. If I am 40 years old and thus assume I have up to 50 years left in retirement, and I want to maintain a 4% withdrawal rate ($40,000 a year from a $1,000,000 portfolio that is 65% stocks/30% bonds/5% cash), the tool uses Monte Carlo simulations to calculate that I have an 80% chance of lasting 50 years.

There is effectively one output: the odds of not running out of money. Either you still have at least a dollar, or you don’t. In my example, I have an 80% chance of having $1 or more at age 90.

But what if you also considered the odds of running out of time? Yes, that’s a euphemism for dying. (Ever notice how many of those we have?) In another neat tool from Engaging-Data.com, Will Your Money Last If You Retire Early? adds some helpful nuance to this analysis. You input the same types of information, but now in any given year you are provided the overall odds of each of these things happening:

  • Red – You are alive, but ran out of money.
  • Light green – You are alive, with less money than you started with. (Kinda nervous?)
  • Green – You are alive, with between 100% and 200% of what you started with. (Nice and comfy.)
  • Dark green – You are alive, with over 200% of what you started with. (In hindsight, I didn’t need to save so much…)
  • Grey – You are pushing up daisies. (In hindsight, maybe should’ve retired earlier…)

Here are sample results for the early retirement scenario above at 4% withdrawal rate (age 40, retirement horizon 50 years, $40k from a $1m 65/35/5 portfolio). I picked the female mortality table – if you have a male/female couple, it’s safer to pick the person likely to live longer.

There’s an angry streak of red where I’m broke. Of course, there’s a bigger streak of grey where I’m not breathing.

Here’s the same scenario, except with a lower 3% withdrawal rate ($30,000 a year from a $1,000,000 initial portfolio):

That change got rid of the red, but there is a lot of dark green. (1% makes a big difference.)

Here are sample results for a more traditional retirement scenario: (age 65, retirement horizon 25 years, $40k from a $1m 65/35/5 portfolio)

As a financially conservative person, these charts help illustrate why I prefer working with a 3% safe withdrawal rate for early retirement (50 and under) and 4% safe withdrawal rate for traditional retirement (closer to 65).

My favorite part of this tool is that it makes you take into account your mortality. It’s not all about staying above $1 in the bank, but also about maximizing your years of freedom. If you’re 40, you have a 10% chance of dying before even reaching 65. (This is why most people know someone who died shortly after retirement.) Is it better to have zero chance of broke and be 70, or 5% chance of broke and 60 with 10 more years of retirement (and 10 fewer years of work)? It is better to live a little more luxuriously for shorter time, or a little more frugally for a longer time? Playing around with all the different input variables might help you weigh the options.

Northern Bank Direct Money Market Review – 2.26% APY Guaranteed Through June 2019

Update: As of 6/20/18, the rate is now down to 1.50% APY. I hope everyone who was interested got the 2.26% APY rate, you definitely had time and they did give roughly a 24-hour notice.

Here comes another new “Direct” bank leapfrogging the current competition for some attention. The Northern Bank Direct Money Market account is offering 2.26% APY on average daily balances up to $250,000, and the rate is guaranteed through June 30, 2019. Of course, another bank could take the throne tomorrow, but at least this one comes with a rate guarantee. Other highlights:

  • $5,000 minimum to open.
  • Includes limited checkwriting and ATM debit card access.
  • No minimum balance requirements or monthly service charges.
  • Interest is compounded monthly and credited monthly. If you close your account before the interest is credited, you will not receive the accrued interest.
  • Read full review for notable quirks.

Northern Bank Direct is the online division of Northern Bank, a community bank in the New England area. You must open accounts online, but you can do transactions in their branches and use the NBTC Mobile Banking apps. They also offer various certificates of deposit, including currently a 30-month CD at 3.01% APY ($500 minimum to open, 12-month early withdrawal penalty). Their routing number is 011303097. You can contact them at 844-348-8996 EST Monday-Friday: 9a-6p, or via email to nbdirect@nbtc.com.

Money Market features. This is a money market account, which is similar to a savings account but adds limited checkwriting and an ATM debit card. You are still limited to 6 withdrawals per month, whether via online electronic funds transfer, check, wire, or ATM machine.

ACH limitations. Northern Bank Direct has a somewhat weird rule that if you initiate a electronic transfer from your Northern Bank Direct account, there is a maximum daily limit of $5,000.00 (or the available balance in your account, whichever is less) for Interbank (external) transfers per transaction; $5,000 in aggregate per day; and $25,000 in aggregate per calendar month. If you initiate the electronic transfer from an external financial institution, Northern Bank Direct does not impose a limit on the amount of the transfer.

Notable fees. According to their full Deposit Account Agreement, there are a few other fees that caught my eye:

  • Account closure (by mail): $10
  • Dormant Accounts fee (per month– starting in the 13th month for account balances less than $500.00): $4.00
  • External Transfer Fee (per transfer): $3
  • New account closure within 120 days: $25

It appears that not only do they limit your transactions to $5,000 per day ($25,000 per month), they will also charge you $3 if you initiate the transfer from your Northern Bank Direct account. There are some reports that they are removing the $3 fee, but I still see it on their online fee schedule. Hopefully, you already have a favorite “hub” bank account with free, fast transfers and high dollar limits (mine is Ally Bank).

These fees are notable as other online savings accounts have all of the following: no minimum opening balance, no minimum balance requirement, no early closure fee, and/or no inactivity fee.

Smartphone app. It’s amazing how much I bank from my phone these days, from checking balances to mobile check deposit. Based on the app store screenshots, it looks like Northern Bank also outsourced their back-end software to Fidelity National Information Services (subdomain ibanking-services.com). In my experience, the app is basic but functional. Mobile check deposit and Touch ID are supported.

Bottom line. The Northern Bank Direct Money Market account is offering 2.26% APY on average daily balances up to $250,000, with the rate guaranteed through June 30, 2019 ($5,000 minimum to open). In terms of liquid savings accounts, this is the highest rate currently available (with a few quirks noted above). There are a few short-term CDs with higher rates (and withdrawal penalties), but this is more like a no-penalty CD plus you can also add funds at any time. If you have a large cash balance and you want to preserve your liquidity options, this is something to consider. Act fast though, as previous similar accounts have closed to new applications after a few weeks.

Check out my Ultimate Rate-Chaser Calculator to estimate how much additional interest you’d earn if you switched over and make an informed decision.

How To Build A 4-Week Treasury Bill Ladder: A Visual Guide

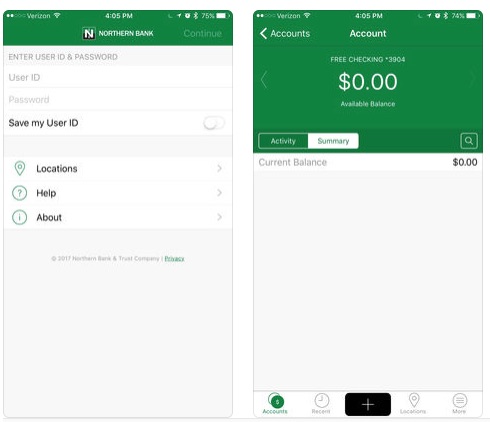
For my magic trick today, I will be resurrecting a post from over 11 years ago! That’s the last time it there was any significant interest for an individual to buy Treasury Bills instead of using a top-yielding bank account. As of 6/18/18, a 4-week T-Bill rose to a 1.83% yield. Since T-Bill interest is exempt from state and local income taxes, your tax-equivalent yield could top 2% today.

This is a short visual guide on creating a Treasury Bill ladder, which maximizes your liquidity. If you use the TreasuryDirect website, it now includes an option for automatic reinvestment upon maturity, which makes things even easier after the initial setup.

Quick Facts

  1. Treasury Bills are purchased at a discount and redeemed at the full par value. So for each $1,000 worth, you’ll pay ~$99x dollars upon issue and receive $1000 upon maturity.
  2. You can either buy them at TreasuryDirect.gov, or from a brokerage firm that offers a bond desk like Fidelity, Vanguard, TD Ameritrade, etc.
  3. Rates are set by auction, so you will not know your exact interest rate before you commit to buy. You can look at historical rates to help get you a ballpark estimate.
  4. 4-week T-Bill auctions are normally held on Tuesdays, and the T-Bills both issue and mature on Thursdays. Here is a list of upcoming auctions.
  5. You must schedule your non-competitive bid before 11am Eastern time on the auction date (Tuesdays), otherwise you are pushed to next week. (TreasuryDirect now allows automatic reinvestment upon maturity for up to 2 years.)
  6. The transfer of money to/from your bank account upon purchase/maturity is well-synchronized. That is, if one Treasury Bill matures (deposits $1,000) and another is issued on the same day (withdraws $995), your bank account should have a net positive $5 balance at the end of that day.

Visual Guide To Setting Up A Treasury Bill Ladder
Laddering is a method of purchasing that increases the liquidity of fixed term investments such as Treasury Bills. Imagine if you bought a T-Bill every week, and each one lasts for 4 weeks. After four weeks, you could simply use the proceeds of your first T-Bill to purchase your fifth T-Bill. The week after that, you could use the proceeds from your second T-Bill to purchase your 6th T-Bill, and so on forever. If you stopped buying T-Bills, you would get $1,000 back each week until all have matured.

TreasuryDirect now has a minimum purchase amount of $100, allowed in increments of $100. This means you would need to commit 4 x $100 = $400 to create a weekly ladder. Other brokerage firms may impose a higher $1,000 minimum per T-Bill. If you don’t have enough, you can simply buy them at less frequent intervals. Below are four visual examples for buying a $1,000 T-Bill every month, every two weeks, and every week:

Monthly Ladder of $1,000 T-Bills ($1,000 committed)
Assuming a discount value of $995:
Week #1: T-Bill #1 will be issued on Thursday (net taken from bank account: -$995)
Week #5: T-Bill #1 will mature (+$1,000) and T-Bill #2 will be issued (-$995) on Thursday (net: -$990)
(and so on…)


In some months, there may be a gap between the T-Bill maturing and the next one issuing, but you should never have more than $1,000 invested “outside” in T-Bills. However, you may have to wait up to 28 days for your money to come back to you.

Bi-Weekly Ladder of $1,000 T-Bills ($2,000 committed)
Week #1: T-Bill #1 issued on Thursday (net: -$995)
Week #3: T-Bill #2 issued on Thursday (-$1990)
Week #5: T-Bill #1 matures, T-Bill #3 issued on Thursday (-$1985)
Week #7: T-Bill #2 matures, T-Bill #4 issued on Thursday (-$1980)
Week #9: T-Bill #3 matures, T-Bill #5 issued on Thursday (-$1975)
(and so on…)

As you can see, you should never need more than $2,000 committed to T-Bills using a bi-weekly ladder. If you have $2,000, this would be a better way to set up your investments since in the worst case you can stop buying new T-Bills and get access to half your investment in 14 days once the ladder is constructed.

Weekly Ladder of $1,000 T-Bills ($4,000 committed)
Week #1: T-Bill #1 issued on Thursday (net: -$995)
Week #2: T-Bill #2 issued on Thursday (-$1990)
Week #3: T-Bill #3 issued on Thursday (-$2985)
Week #4: T-Bill #4 issued on Thursday (-$3980)
Week #5: T-Bill #1 matures, T-Bill #5 issued on Thursday (-$3975)
Week #6: T-Bill #2 matures, T-Bill #6 issued on Thursday (-$3970)
Week #7: T-Bill #3 matures, T-Bill #7 issued on Thursday (-$3965)
(and so on…)

Practical Details
If you don’t already have a preferred brokerage account, you can buy T-Bills online at TreasuryDirect.gov. Check out the TreasuryDirect Guided Tour for a walkthrough; It’s very similar to opening an online bank account. You will need to verify your identity with your Social Security Number, but there is no credit check. You will need a bank account as an initial source of funds.

After logging in, do not use “Purchase Express”, click on the “Buy Direct” tab on top instead, and choose “Bills”. Here is a screenshot of the entire purchase screen, including the option for automatic reinvestment (into another T-Bill of the same type and term):

If you choose your interval correctly, everything pretty much goes on autopilot. For a 4 x $1,000 weekly ladder, you would just set up 4 purchases and have them reinvest automatically for up to 2 years. Note that I chose both the source and destination of funds to be my bank account. If you are using a savings account, remember that they are limited to 6 withdrawals per month. If you want to avoid the extra transactions at the expense of a little bit of interest, you may choose to use the “Certificate of Indebtedness” as your source or destination account. Just think of it as a savings account that pays no interest that serves as a holding place for money. Obviously, you don’t want to keep too much in there.

Bottom line. Individuals can invest in Treasury Bills, which are Treasury Bonds with a maturity of one year or less. T-Bill interest rates are now competitive with top online bank accounts, even exceeding them in some cases due to the interest being exempt from state income taxes. Structuring them as a T-Bill ladder is a way to increase your liquidity. By creating a ladder of 4-week T-Bills maturing every week, you can always have access to 1/4th of your funds in a week, 1/2 of your funds in 2 weeks, and so on.

Age-Sensitive Safe Withdrawal Rate Strategy? Age Divided By 20

Should a person who retires at age 70 withdraw the same amount of money from their portfolio as someone who is age 40? You’re talking about a retirement period that is likely twice as long as the other. In an article titled The “Feel Free” Retirement Spending Strategy [pdf], Evan Inglis of Nuveen Asset Management and a fellow of the Society of Actuaries proposed a safe withdrawal strategy that adjusts for age.

To determine a safe percentage of savings to spend, just divide your age by 20 (for couples, use the younger spouse’s age). For someone who is 70 years old, it’s safe to spend 3.5 percent (70/20 = 3.5) of their savings. That is the amount one can spend over and above the amount of Social Security, pension, employment or other annuity-type income. I call this the “feel free” spending level because one can feel free to spend at this level with little worry about significantly depleting one’s savings.

You can think of this is as a lower bound. He also proposes an upper bound:

At the other end of the spectrum, divide your age by 10 to get what I call the “no more” level of spending. If one regularly spends a percentage of their savings that is close to their age divided by 10 (e.g., at age 70, 70/10 = 7.0 percent) then their available spending will almost certainly drop significantly over the years, especially after inflation is considered.

Therefore, the lower and upper bounds for a person retiring at 70 would be 3.5% and 7%. The lower and upper bounds for a person retiring at 40 would be 2% and 4%.

Note that he also admits that spending 3% of your assets each year is an even simpler rule of thumb:

Even though there are lots of things to think about, for the vast majority of people, very simple guidelines will be most useful. My simple answer to the questions “How much can I spend?” or “Do we have money enough saved?” is that if someone plans to spend less than 3 percent of their assets in a year (over and above any Social Security or other pension, annuity or employment income), then they have enough money saved and they aren’t spending too much. This is a fairly conservative estimate, but people tell me they want to be conservative with their retirement spending. They would rather feel safe than spend a lot of money, and I think that is very appropriate in our current economic environment.

Another idea to add to your knowledge banks. Basically, if you are young you have to be sensitive about permanently damaging your portfolio early on with the double-whammy of negative returns and high spending.

Others will say that you should spend more when you’re young, as you’ll be able to enjoy it more. That may be true if you have long-term care insurance. I know lots of people who are still quite active and traveling at 70. I’m also at that age where I have checked out some of those “nice” assisted-living facilities for my parents, and they cost serious bucks.

My Money Blog Portfolio Income – June 2018

dividendmono225When it comes to making your portfolio last a lifetime, you may be surprised at how long that might be. According to this Vanguard longevity tool, for a couple both age 40 today, there is a 50% chance that one will live to 88. That’s 48 years.

For a young person making a plan to reach financial independence at a very early age (under 50), I think using a 3% withdrawal rate is a reasonable rule of thumb. For someone retiring at a more traditional age (closer to 65), I think 4% is a reasonable rule of thumb.

In addition, I track the dividend yield of my portfolio. This is not necessarily my spending target, but more of a very safe benchmark number. Having lived through a crisis like 2008, I know that it can be hard to appreciate “very safe” things until the poo hits the fan. The analogy I fall back on is owning a rental property. If you are reliably getting rent checks that increase with inflation, you can sit back calmly and ignore what the house might sell for on the open market.

Specifically, I track the “TTM Yield” or “12 Mo. Yield” from Morningstar, which the sum of a fund’s total trailing 12-month interest and dividend payments divided by the last month’s ending share price (NAV) plus any capital gains distributed over the same period. I like this measure because it is based on historical distributions and not a forecast. Below is a very close approximation of my most recent portfolio update (66% stocks and 34% bonds).

Asset Class / Fund % of Portfolio Trailing 12-Month Yield (Taken 6/11/18) Yield Contribution
US Total Stock
Vanguard Total Stock Market Fund (VTI, VTSAX)
25% 1.69% 0.42%
US Small Value
Vanguard Small-Cap Value ETF (VBR)
5% 1.82% 0.09%
International Total Stock
Vanguard Total International Stock Market Fund (VXUS, VTIAX)
25% 2.75% 0.69%
Emerging Markets
Vanguard Emerging Markets ETF (VWO)
5% 2.42% 0.12%
US Real Estate
Vanguard REIT Index Fund (VNQ, VGSLX)
6% 3.48% 0.21%
Intermediate-Term High Quality Bonds
Vanguard Intermediate-Term Tax-Exempt Fund (VWIUX)
17% 2.86% 0.49%
Inflation-Linked Treasury Bonds
Vanguard Inflation-Protected Securities Fund (VAIPX)
17% 2.64% 0.45%
Totals 100% 2.47%


Our overall plan is still based on a 3% withdrawal rate. This calculation tells us that 2.5% will come out as income “naturally”, and we would have to take the remaining 0.5% by selling shares. Living off a portfolio is an area of ongoing debate, so don’t let anyone convince you that there is a “right” answer. I’m not a financial firm convincing you to let me handle your money. I’m not here to pitch you an easily-achievable dream lifestyle. Even if you run a bunch of numbers looking back to 1920, that’s still trying to use 100 years of history to forecast 50 years into the future.

Your life is not a Monte Carlo simulation, and you need a plan to ride out the rough times. We are a real 40-year-old couple with three young kids, and this money has to last us a lifetime (without stomach ulcers). Michael Pollan says that you can sum up his eating advice as “Eat food, not too much, mostly plants.” You can sum up my thoughts on portfolio income as “Spend mostly dividends and interest. Don’t eat too much principal.”

Country Time Lemonade Will Pay Legal Fees For Unlicensed Lemonade Stands

Are you thinking of helping your kid setting up a lemonade stand this summer? Apparently, some young entrepreneurs are getting shut down due to a lack of small business permits. In a very savvy PR move, Country Time Lemonade has offered to reimburse any permit fees or fines (up to $300) that are incurred while operating a lemonade stand. Here’s their “Legal-ade” video:

On one hand, nobody likes bureaucracy. The United States is currently #6 in the world for “ease of doing business” according to the World Bank. On the other hand, perhaps navigating local business laws is a valuable lesson for teens and above. I mean, even the Legal-ade website is crammed full of fine print:

Open to legal residents of the 50 U.S. (including D.C.), who are the parents or legal guardians of a child 14 years of age or younger operating a lemonade stand. Program ends 11:59pm ET on 8/31/18 or when $60,000 worth of offers have been awarded, whichever comes first. For complete Terms and Conditions, including status of available offers, and all other details, visit countrytimelegalade.com.

So many rules. You can’t even be 17 or younger to get reimbursed by Country Time. But hey, now motivated parents can get those permits reimbursed (as long as they haven’t exhausted their $60,000 budget). A framed official business permit for their first lemonade stand will go great on my kids’ walls, right next to their framed Berkshire Hathaway stock certificate… Class B share, unfortunately.

Free Happy Socks with $100 Amazon Gift Card

I’m a sucker for free. Amazon currently has a limited edition run of $100 Gift Card Boxes with Happy Socks. Pay $100 and get a $100 gift card, a nice gift box, and a pair of Happy Socks inside. You could make it an extra nice gift for someone else during this graduation season, or you could… treat yo-self and simply spend the gift cards without changing your spending habits. 🙂

Apparently, these Happy Socks from Sweden can run $10 a pair and up. The picture suggests this is their larger “41-46” size, which is US Mens 8-12 and US Womens 10-12.5.

Remember to get your 5% cash back if you have the Amazon Prime Rewards Visa Signature Card.