| Retirement Portfolio | Actual | Target |
| Asset Class / Fund | % | % |
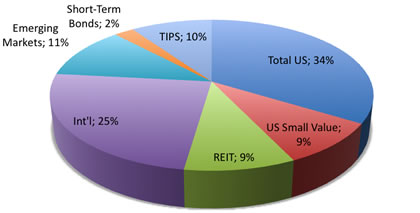
| Broad US Stock Market ($64,794) | 33.8% | 34% |
| VTSMX – Vanguard Total Stock Market Index Fund | ||
| DISFX – Diversified Stock Index Institutional Fund* | ||
| FSEMX – Fidelity Spartan Extended Market Index Fund* | ||
| US Small-Cap Value ($17,554) | 9.1% | 8.5% |
| VISVX – Vanguard Small Cap Value Index Fund | ||
| Real Estate (REITs) $18,004 | 9.4% | 8.5% |
| VGSIX – Vanguard REIT Index Fund | ||
| Broad International Developed $46,820 | 24.4% | 25.5% |
| FSIIX – Fidelity Spartan International Index Fund* | ||
| International Emerging Markets $21,678 | 11.3% | 8.5% |
| VEIEX – Vanguard Emerging Markets Stock Index Fund | ||
| Bonds – Short-Term $4,484 | 2.3% | 3.8% |
| VFISX – Vanguard Short-Term Treasury Fund | ||
| Bonds – Inflation-Indexed $18,568 | 9.7% | 11.3% |
| VIPSX – Vanguard Inflation-Protected Securities Fund | ||
| Total Portfolio Value | $191,902 | |
| * denotes 401(k) holding given limited investment options. |
Like many others, for most of this year I’ve just been trying to keep my head down, make my regular stock contributions like a good boy, and not looking at my statement balances too much! There’s been a lot of “wow, my portfolio isn’t so bad anymore” talk due to the recent market run, so I figured it was time for a checkup. You know of course, that this also means the market will tank today… 🙂
Contribution Details
So far in 2009, we have made the following contributions:
- $5,000 x 2 for 2008 non-deductible IRA contributions
- $5,000 x 2 for 2009 IRA contributions
- $33,052 for both of our 401k contributions, including salary deferral and company match. One is maxed out, the other has a little left to go.
2009 Performance
In my last update back in April, I had found our year-to-date performance to be about -15%. According to my spreadsheet, the 2009 year-to-date dollar-weighted performance of our personal portfolio is now 41% YTD.
For reference, the Vanguard S&P 500 Fund (VFINX) has returned 20.52% YTD, their FTSE All World Ex-US fund (VFWIX) has returned 35.72% YTD, and their Total Bond Index fund (VBMFX) is 5.11% YTD as of 9/18/09. The Vanguard Target 2045 Fund (VTIVX) has returned 23.4% YTD, which as a similar stock/bond breakdown to our portfolio, but less international exposure. Part of the good relative performance (which was previously relatively poor) is also likely due due to the timing of my large lump-sum investments.
Investment Changes
We have used our new contributions to keep us close to our asset allocation target, with a 85% stocks/15% bonds split. Right now, we are not too far off. The target percentages for each asset class are shown above as well. Currently, with the run-up in equities, we are a bit underweight in bonds.
You can view all my previous portfolio snapshots here.
 The Best Credit Card Bonus Offers – 2026
 Big List of Free Stocks from Brokerage Apps
 Best Interest Rates on Cash - 2026
 Free Credit Scores x 3 + Free Credit Monitoring
 Best No Fee 0% APR Balance Transfer Offers
 Little-Known Cellular Data Plans That Can Save Big Money
 How To Haggle Your Cable or Direct TV Bill
 Big List of Free Consumer Data Reports (Credit, Rent, Work)
Out of curiosity, what is the break down of your US Broad Stock Market? How much do you have in the mid cap area?
Thanks
I have not had access to invest in a 401k so I have invested the $5k in a trad IRA. I now have access to a 401k this year and plan to invest the max in it.
Is it still possible to also invest the $5k in a trad IRA?
I thought it was one or the other but not both.
Thanks, Jimmy
Is it possible to contribute to both 401k & IRA same yr? My tax consultant told me we can not.
Thanks!
Hello,
Is there a tool online that can create a chart/breakdown like you have above? I have ameritrade, however their breakdown is not good. I even called them about it. however do to limitations they said they could not fix it.
thanks
By maxing out your 401k already, does that limit you to the amount of company match you can receive? Assuming they only match a certain percentage per pay period.
VEIEX – Vanguard Emerging Markets Stock Index Fund
Awesome fund that I just opened earlier this year in March.
Jonathan:
If you have a 401k plan at work AND if your AIG is over $109k you are not able to deduct any IRA contributions:
http://www.irs.gov/retirement/participant/article/0,,id=202516,00.html
You may want to review your eligibility for this deduction.
Cheers,
Hi Jonathan, I always am confused about contributing to IRA. If Me and my wife together make more than 200k and both have 403,401 options, can I still contribute to IRA. they talk about AGI which I can never understand.thanks.praveen.
@wayne – The Broad US Stock Market is around 20% mid-cap I think.
https://www.mymoneyblog.com/archives/2007/01/mutual-fund-and-etf-asset-class-definitions-stocks.html
&jimmy – You can always contribute to the IRA, but it may not be deductible based on your income. In some cases, contributing to a Roth IRA is a better idea if you can. See Drew’s comment.
I am contributing to a non-deductible IRA, but am planning to roll over to a Roth IRA in 2010 as long as they don’t change the current rules by then. I am currently not eligible for a Roth IRA either.
@Russ – The 2009 limit is $16,500 for salary deferrals per person, but that does not include company matches. The total limit for qualified plan contributions is $49,000.
I’m confused about how you calculate your rate-of-return. How come the total is greater than the sum of its parts?
For example, You mention that your Rate of return YTD is 41%, but the fund with the highest rate-of-return in your portfolio has only yielded so far 35.72% (VFWIX). Put in another way, if your portfolio consisted only of VFWIX, wouldn’t your rate-of-return be at best 35.72%?
Ha, ha… You’re right, the market will probably tank today! But you’re right to keep plowing money in quarter-after-quarter, year-after-year. Dollar cost averaging has proven effective over the long-term, and as long as you reinvest the dividends from your index funds, the results will be very good.
One question… I assume you’ve made non-deductible IRA contributions because you earn too much to make Roth IRA contributions. Do you plan on taking advantage of a Roth IRA conversion in 2010, given the expiration of the $100,000 income limit?
Jonathon, what software if any are you using to build the pie chart displayed in your post?
Pie chart is made with MS Excel for Mac.
Victor:
YTD returns will be realized if you invest all your money on the first day of the year and hold until today.
If you invest spread out your contributions (e.g. a semi-monthly 401k contribution) then your personalized, money-weighted return will differ from the YTD return as on some contribution dates you invest in the market when prices are lower than they were on January 1 and on other dates you invest when prices are higher than they were on January 1.
Prices were lower in March than January 09 which can lead to higher YTD portfolio returns than YTD returns.
do you manage your 401k and/or ira allocation separate?
or you combine everything?
I have 401k in different firm. IRA in different firm. just wonder how you do it. thanks.
Hi,
I heard a lot about a second down in the market this fall. the following website
http://www.europe2020.org/spip.php?article618&lang=en
What do you think of their prediction ??
That’s one of the reason I stay 100% cash.
Never use 3D pie charts. Please. They are horrible at conveying information.
Total Portfolio Value $191,902
You’re kickin’ ass since you first got started Jonathan. Keep up the good work!
Based on your series of posts on asset allocation, I thought the Bond portfolio would be split evenly between Treasury and TIPS. Why is your Target allocation different in the pie chart above? Would definitely be interested in your thought process.
Thanks
Unfortunately, pie charts are a very poor way to display quantitative information–especially if they are tilted. In this pie chart, the 10% TIPS piece looks smaller than the 9% US Small Values piece. Also the 9% REITS piece looks larger than the 9% US Small values piece. See Edward Tufte’s book, The Visual Display of Quantitative Information for more on this. See also his web site at
http://www.edwardtufte.com/tufte/index
I have been reading about Schwab’s ETF products. Yes, they are less expensive, but are they as good at producing positive returns? After the fees, what would be the best “bang for the buck?” I would really like to have someone who knows what they are doing offer their input. Thank you.
I’ve just added you to my blogroll. Keep up the great work. I look forward to reading more about your personal journey.
Andrew
Hi your last portfolio snapshot dates from September 2009 – any updates??
Hey Jonathan. I absolutely love your website. I’d love if you visited mine and maybe gave me some pointers on topics I could write about abd ways to make it more aesthetically pleasing.
Just stumbled on this post, but based on your portfolio you must be up significantly from this post due to the recent market growth.
Pie charts, and especially tilted pie charts, are one of the worst ways to display data. For example, in this chart the 9% REIT looks larger than the 10% TIPS and the 25% International looks at least as large as the 34% Total US.
Google Ed Tufte to learn about good ways to display quantitative information.