One of the problems with personal finance content is that there are really only so many ways you can say “buy a low-cost stock index ETF and do nothing for 20+ years”. The pressure to make it more complicated is quite intense, if only to cure your own boredom. If only more action actually resulted in higher returns.
The vast majority of people cannot do reliably better than a US Total Market index fund or S&P 500 index fund in the world of publicly-traded stocks. Each decade, more and more people have realized that low-cost market-cap weighting is a very simple yet powerful trading algorithm that automatically adjusts to guarantee that you own all the big winners while avoiding as much of the middlemen fees and taxes as possible.
As Charlie Munger says, “The big money is not in the buying and the selling but in the waiting.” To illustrate, John Rekenthaler has a new Morningstar article called How Time Horizon Affects the Odds of Equity Investing with some excellent charts about the returns of portfolios of varying proportions of stocks and bonds over different periods of time (1, 5, 10, and 20 years). Check out all the charts there, but here are some highlights and commentary.
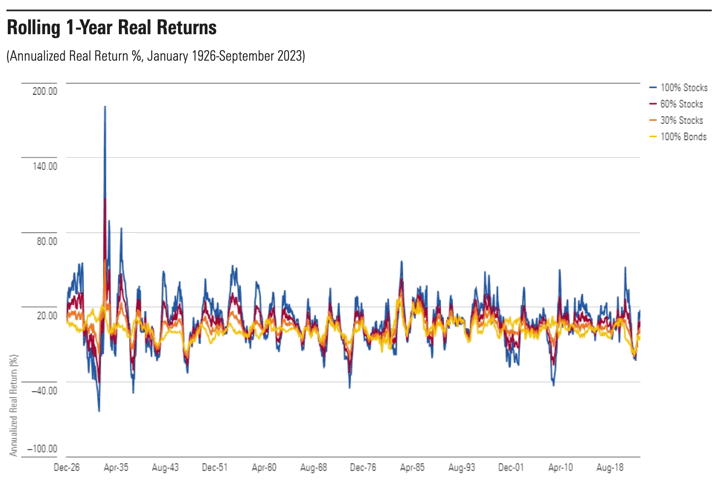
Over a single year period, who knows what you will get? Stocks might win by a lot, or they might lose by a lot. You can also see from the vertical axis markers that the potential swings are pretty wild. Double your money? Possible. Lose half your money? Also possible.
However, over 20-year rolling period, you can see that a 100% stock portfolio beat everything else 99% of the time. Most of the time, by a LOT. Even when stocks performed relatively poorly, it’s only by a little.
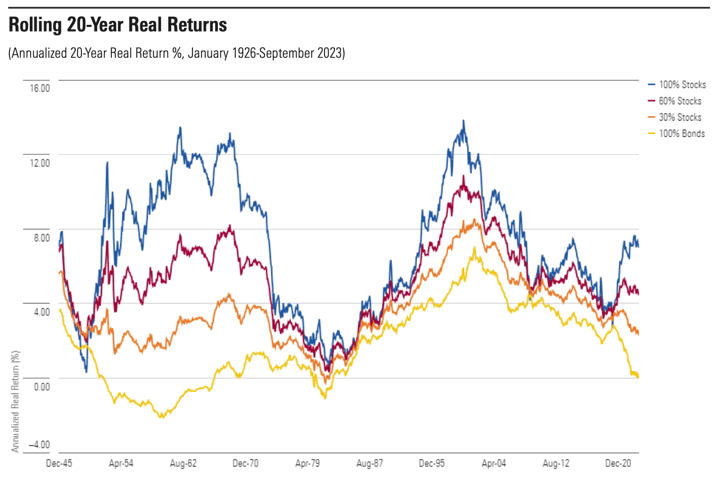
Finally, notice that in none of the 20-year rolling periods did stocks perform worse than inflation. They always matched inflation at the very minimum (0% real return). Young folks can consider this justification for why most Target Date Retirement funds start at 90%+ stocks for people in their 20s and even 30s.
I would also consider that statistic in the context of the “new & improved no risk portfolio” and you may feel better about the long-term safety of your portfolio.
 The Best Credit Card Bonus Offers – 2026
 Big List of Free Stocks from Brokerage Apps
 Best Interest Rates on Cash - 2026
 Free Credit Scores x 3 + Free Credit Monitoring
 Best No Fee 0% APR Balance Transfer Offers
 Little-Known Cellular Data Plans That Can Save Big Money
 How To Haggle Your Cable or Direct TV Bill
 Big List of Free Consumer Data Reports (Credit, Rent, Work)
Speak Your Mind