Another theory of predicting future stock market returns states that there are three main components to long-term stock market performance. Amongst many others, I learned this from authors and investors Jack Bogle and William Bernstein.
Part 1: Dividend Yield
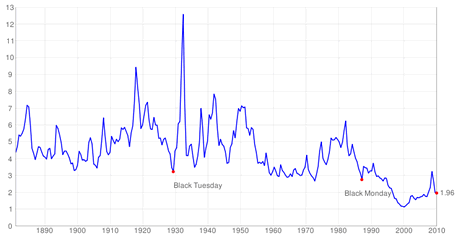
If your stock distributes 2% in dividends each year, then you will have a 2% contribution towards of return. This is what dividend investors love to see coming in each quarter, and is relatively easy to track for a large group of companies. Here it is over time for the S&P 500, courtesy of Multpl.com:
Part 2: Earnings Growth
If earnings stay constant, then all other things equal, one would expect the share price of your company to stay constant as well. If the earnings grow by 5% every year, then your share price will grow by 5% per year. Thus, earnings growth rate is a vital component of total return.
If your portfolio was all of the stocks traded in the United States, like that of a broad-based index fund, this would create a connection between the growth rate of the nation’s Gross Domestic Product and the earnings growth rates of all US companies. In other words, the fundamental return is based on GDP growth. In turn, the GDP growth rate is connected to population growth and productivity per person.
These two parts added to together are coined the fundamental return:
Fundamental Return = Earnings Growth + Dividend Yield
Some bad news: Now, from 1950-2000, fundamental returns were 10%: 4% dividend yield and a 6% earnings growth rate. These days, the S&P 500 has a dividend yield of only about 2%. Earnings growth rate estimates are subject to debate, but they hover around 5-6%.
Part 3: Changes in P/E Ratio
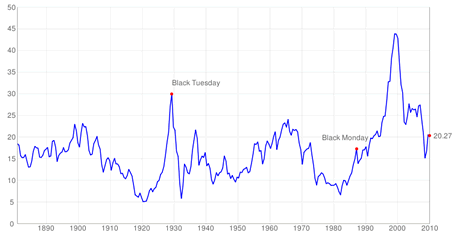
The price-to-earnings (P/E) ratio is the price per share divided by earnings per share. In other words, it is how much investors are willing to pay for each unit of earnings. If they are willing to pay 20 times annual earnings, the share price of the stock will be twice as high as if they only paid 10 times earnings. This part is denoted the speculative return, as it has changed throughout history. Here it is again for the S&P 500:
In 1950, the P/E ratio was less than 10. As of right now in mid-2010, it is 20. It is very unlikely that this more than doubling of price-per-share will happen again, with the historical average being around 15. (During the dot-com bubble, the P/E ratio was over 40. In 2008, it was over 25.) This will lead to a zero, and quite possible negative, future speculative return!
Summary
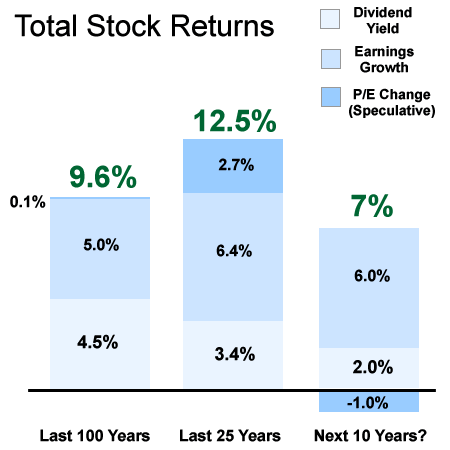
When predicting future returns, you have to look at all the sources of those expected returns. Fundamental return is still a solid reason why stock prices will go up on the long-term, especially if you are not investing only in one country or economy. Some people call it a belief in capitalism, that economic growth will continue and GDP will continue to increase. I simply believe in the passion and motivation of all the people out there, from Sweden to China to Brazil. However, there is good evidence that you might not be getting 10% historical returns due to P/E ratio contraction.
In a recent column, Larry Swedroe shares that the forecasts that he has read are predicting a 5% total annual growth in earnings and 2% dividends for a total return of 7% (similar to above). Inflation is predicted at 2.5%. However, he points out the current minimal-risk return is pretty low as well, so you need consider the big picture:
The bottom line is that while the expected nominal return to stocks is lower than the historical return, so is the expected return to Treasury bonds. You should decide if the expected risk premium for stocks is sufficient given your unique ability, willingness and need to take risk.
 The Best Credit Card Bonus Offers – March 2024
 Big List of Free Stocks from Brokerage Apps
 Best Interest Rates on Cash - March 2024
 Free Credit Scores x 3 + Free Credit Monitoring
 Best No Fee 0% APR Balance Transfer Offers
 Little-Known Cellular Data Plans That Can Save Big Money
 How To Haggle Your Cable or Direct TV Bill
 Big List of Free Consumer Data Reports (Credit, Rent, Work)
Actually, dividend investors focus on the growth of dividend payments over time. The chart below shows the growth in dividend payments for S&P 500 between 1977 and 2008: http://bit.ly/cSWrip
Dividend payments are less volatile and thus relying on dividend income makes better sense than relying exclusively on total returns..
Good post. Don’t forget that you don’t have to buy the entire market (although that is probably the best way to go for most people) but could instead construct a portfolio of stocks with higher than average dividend yields and/or lower P/E ratios, in order to get a slightly better expected return than that of the market. I know you’re big on indexing (as am I) but within the framework you’ve presented lies the method to outperform the index.
@DGI – Thanks for the link, here’s another chart of the S&P 500 dividend (inflation-adjusted) since 1881-2010, which includes the recent market drops:
http://www.multpl.com/s-p-500-dividend/
I like the overall up trend as well, but isn’t the price of each dividend dollar constantly changing if you are still buying into the market? If you take the inverse of the dividend yield, dividends seem “expensive” right now.
@Andy – Do you have data that, say, if you take the top-third of dividend yielding stocks since 1950, that that group has the same overall share price return as the total market, plus the dividend yield? I’ve been reading all these theories about retained earnings as opposed to spitting them out as dividends.
Jonathan,
I’d be curious to know what your aggregate rate of return has been on your market investments. I.e. out of your current savings/investments what amount is a result of your ability to put away a lot of money and what amount is a result of market gains. How do your returns after fees compare to say the S&P 500?
@Walter – I’d be curious as well, I don’t know if I even have the data stored somewhere to calculate that. My investments are 99% passive, so they wouldn’t exceed a index of say 40% S&P 500, 40% International, 10% US Treasury and 10% Treasury Inflation-Protected bonds.
I started really accumulating from 2006-2010, so I would say that most of my money is from savings and not much from any gains during that short span.
Jonathan,
If you look at dividends from S&P 500 index perspective, you are not getting much in yield right now. That’s because only 370 out of 500 stocks pay dividends. The 370 dividend payers yield 2.4%, while the index as a whole yields 1.80%.
http://www.indexarb.com/dividendYieldSortedsp.html
On the other hand, the yield on Dow Jones is between 2.90% and 3%, and only one of of 30 stocks doesn’t pay a dividend.
This being said dividend yields are low, but you should also remember that bond yields are low as well. 30 Year Treasury Bonds yield 4.20%, 10 year treasuries yield 3.25%.