Search Results for: swedroe

Target Asset Allocation for Investment Portfolio

My Money Blog has partnered with CardRatings and may receive a commission from card issuers. Some or all of the card offers that appear on this site are from advertisers and may impact how and where card products appear on the site. MyMoneyBlog.com does not include all card companies or all available card offers. All opinions expressed are the author’s alone.

Asset allocation (AA) is an important part of portfolio design, and I like pinning down a target asset allocation for personal reference. This helps keep me focused as my portfolio shifts over time and makes it easy to re-balance back. For some educational posts on this topic, please refer to my asset allocation starter guide.

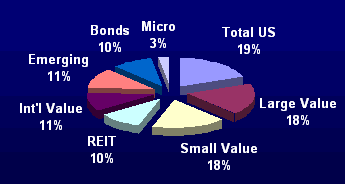
Below is my updated target asset allocation. Here is my target asset allocation from 2008. It’s not dramatically different, but I’ll try to explain the slight changes below. This is just my own AA, and I think everyone should develop their own based on their own beliefs and learning. If you just copy someone else’s without thinking, when things go awry you won’t have the foundation to stick to your guns. I have been strongly influenced by the writings of Jack Bogle, William Bernstein, David Swensen, Rick Ferri, and Larry Swedroe.

Stocks

I separate things out first into stocks and bonds, and then later it’s easy to go 60% stocks/40% bonds and so on. Here’s my stocks-only breakdown:

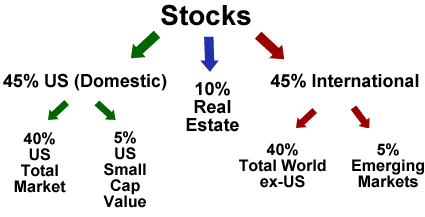
  • I now do a 50/50 split between US and International stocks. In general, I would like to mimic the overall world investment landscape. On a market cap basis, the US stock market is now about 45% of the world, while everyone else takes up 55%. 50/50 is just simpler, with a slight tilt towards domestic stocks.
  • I consider REITs a separate real estate asset class. I used to put Real Estate under US stocks since I only held US Real Estate Investment Trusts (REITs), but in the future I would be open to investing in foreign real estate as property laws improve and investing costs drop.
  • On the US side, I add some extra small-cap value companies. Historically, adding stocks of smaller companies with value characteristics (as opposed to growth) has improved the returns of portfolios while lowering volatility. There is debate amongst portfolio theories as to why this happened and if it will continue.

    If you buy a “total market” mutual fund or ETF, you’ll already own many of these types of companies (although many will not be held due to their small size relative to the big mega-corporations). I feel this adds a bit of diversification.

  • On the international side, I add a little extra exposure to emerging markets. You may be surprised to know that “emerging” countries like China, Brazil, Korea, India, Russia, and Taiwan already make up 26% of the world’s markets when you remove the US. These are countries that have a greater potential for growth, but also lots of ups and downs. I add a little bit more than market weight for these as well.

Bonds

I try to keep things simple for bonds, partially due to the fact that they are currently a smaller portion of my portfolio.

  • I like a 50/50 split between inflation-linked bonds and nominal bonds. Inflation-protected bonds provide a yield that is guaranteed to be a certain level above inflation. Nominal bonds pay a stated rate that is not adjusted for inflation. I like to balance the benefits of both.
  • Instead of only short-term US Treasuries for nominal bonds, I added some flexibility. I used to invest only in short-term US treasuries, as they provided the best buffer in my portfolio as they were of the highest quality and had a low sensitivity to interest rate fluctuations. Both TIPS and nominal Treasuries did great during the 2009 crash and the subsequent flight-to-quality, but now the yield on Treasuries is just too low in my opinion. There are trillions of dollars from countries and huge institutions around the world that are tucking their money away under the safe Treasury mattress. By venturing into other places they won’t with my tiny portfolio, I feel I can stay relatively safe yet increase my yield significantly. Possibilities include bank CDs, stable value funds, and high-quality municipal bonds.

Want more examples? Here are 8 model portfolios from respected sources, an updated Swensen portfolio, one from PIMCO’s El-Erian, and Ferri’s personal portfolio. Have fun!

My Money Blog has partnered with CardRatings and may receive a commission from card issuers. Some or all of the card offers that appear on this site are from advertisers and may impact how and where card products appear on the site. MyMoneyBlog.com does not include all card companies or all available card offers. All opinions expressed are the author’s alone, and has not been provided nor approved by any of the companies mentioned.

MyMoneyBlog.com is also a member of the Amazon Associate Program, and if you click through to Amazon and make a purchase, I may earn a small commission. Thank you for your support.


Total Stock Returns = Fundamental + Speculative Returns

My Money Blog has partnered with CardRatings and may receive a commission from card issuers. Some or all of the card offers that appear on this site are from advertisers and may impact how and where card products appear on the site. MyMoneyBlog.com does not include all card companies or all available card offers. All opinions expressed are the author’s alone.

Another theory of predicting future stock market returns states that there are three main components to long-term stock market performance. Amongst many others, I learned this from authors and investors Jack Bogle and William Bernstein.

Part 1: Dividend Yield
If your stock distributes 2% in dividends each year, then you will have a 2% contribution towards of return. This is what dividend investors love to see coming in each quarter, and is relatively easy to track for a large group of companies. Here it is over time for the S&P 500, courtesy of Multpl.com:

Part 2: Earnings Growth
If earnings stay constant, then all other things equal, one would expect the share price of your company to stay constant as well. If the earnings grow by 5% every year, then your share price will grow by 5% per year. Thus, earnings growth rate is a vital component of total return.

If your portfolio was all of the stocks traded in the United States, like that of a broad-based index fund, this would create a connection between the growth rate of the nation’s Gross Domestic Product and the earnings growth rates of all US companies. In other words, the fundamental return is based on GDP growth. In turn, the GDP growth rate is connected to population growth and productivity per person.

These two parts added to together are coined the fundamental return:

Fundamental Return = Earnings Growth + Dividend Yield

Some bad news: Now, from 1950-2000, fundamental returns were 10%: 4% dividend yield and a 6% earnings growth rate. These days, the S&P 500 has a dividend yield of only about 2%. Earnings growth rate estimates are subject to debate, but they hover around 5-6%.

Part 3: Changes in P/E Ratio
The price-to-earnings (P/E) ratio is the price per share divided by earnings per share. In other words, it is how much investors are willing to pay for each unit of earnings. If they are willing to pay 20 times annual earnings, the share price of the stock will be twice as high as if they only paid 10 times earnings. This part is denoted the speculative return, as it has changed throughout history. Here it is again for the S&P 500:

In 1950, the P/E ratio was less than 10. As of right now in mid-2010, it is 20. It is very unlikely that this more than doubling of price-per-share will happen again, with the historical average being around 15. (During the dot-com bubble, the P/E ratio was over 40. In 2008, it was over 25.) This will lead to a zero, and quite possible negative, future speculative return!

Summary

When predicting future returns, you have to look at all the sources of those expected returns. Fundamental return is still a solid reason why stock prices will go up on the long-term, especially if you are not investing only in one country or economy. Some people call it a belief in capitalism, that economic growth will continue and GDP will continue to increase. I simply believe in the passion and motivation of all the people out there, from Sweden to China to Brazil. However, there is good evidence that you might not be getting 10% historical returns due to P/E ratio contraction.

In a recent column, Larry Swedroe shares that the forecasts that he has read are predicting a 5% total annual growth in earnings and 2% dividends for a total return of 7% (similar to above). Inflation is predicted at 2.5%. However, he points out the current minimal-risk return is pretty low as well, so you need consider the big picture:

The bottom line is that while the expected nominal return to stocks is lower than the historical return, so is the expected return to Treasury bonds. You should decide if the expected risk premium for stocks is sufficient given your unique ability, willingness and need to take risk.

My Money Blog has partnered with CardRatings and may receive a commission from card issuers. Some or all of the card offers that appear on this site are from advertisers and may impact how and where card products appear on the site. MyMoneyBlog.com does not include all card companies or all available card offers. All opinions expressed are the author’s alone, and has not been provided nor approved by any of the companies mentioned.

MyMoneyBlog.com is also a member of the Amazon Associate Program, and if you click through to Amazon and make a purchase, I may earn a small commission. Thank you for your support.


Tolerable Loss = Half of Equity Allocation Percentage?

My Money Blog has partnered with CardRatings and may receive a commission from card issuers. Some or all of the card offers that appear on this site are from advertisers and may impact how and where card products appear on the site. MyMoneyBlog.com does not include all card companies or all available card offers. All opinions expressed are the author’s alone.

There a regular poster on the Bogleheads forum called Adrian Nenu who always posts the following, which is said to have origins with author Larry Swedroe.

Tolerable Loss x 2 = Equity Allocation < 50%

I don’t know if I agree with the last part that says that your equity position should always be less than 50%. However, the first part seems to offer a good rule of thumb when it comes to investing in a target date retirement fund.

Let’s say you have the Vanguard Target Retirement 2050 Fund (VFIFX) and it currently contains 90% stocks. Using this rule of thumb would mean that a possible one-year loss for such a fund is 45%. You should ask yourself – can you handle a 45% drop in the value of your retirement assets, even if you have 40 years before you need it? The good thing about living through 2008/2009 is that you probably have a better idea of the truth. If you’re going to run for cover in cash, only to buy back in later (like now) when prices are 50% higher, then that’s something to avoid.

One thing that I recommend to my more conservative friends who still want a simple investment is to simply buy a different “date”. For example, if you could purchase the Vanguard 2025 Fund (VTHRX) which has 75% in stocks. Who cares if the label is 2025. Meanwhile, I encourage them to continue to learn more about investing so that the can understand the risks trade-offs better and adjust their tolerances accordingly (up or down).

My Money Blog has partnered with CardRatings and may receive a commission from card issuers. Some or all of the card offers that appear on this site are from advertisers and may impact how and where card products appear on the site. MyMoneyBlog.com does not include all card companies or all available card offers. All opinions expressed are the author’s alone, and has not been provided nor approved by any of the companies mentioned.

MyMoneyBlog.com is also a member of the Amazon Associate Program, and if you click through to Amazon and make a purchase, I may earn a small commission. Thank you for your support.


Power Link Dump: Gas Prices, Commodities, Asset Class Forecasts, & More

My Money Blog has partnered with CardRatings and may receive a commission from card issuers. Some or all of the card offers that appear on this site are from advertisers and may impact how and where card products appear on the site. MyMoneyBlog.com does not include all card companies or all available card offers. All opinions expressed are the author’s alone.

Here are some neat links from readers and interweb wanderings. I want to expand on them later as well.

Petrofix: Hedge and cap gas prices
A website that will let you control your cost of gasoline in the near future – for a price. If gas prices rise, they pay you the difference. If they fall, you are out the hedge price. The risk? Well, first I haven’t checked out the prices. Also you pay now, but who knows if the company will be around to fulfill their promises in the future. I’d rather hedge against higher gas by buying an oil ETF or use real options with better liquidity. (Disclosure: I did buy some OIL in my fun portfolio at end of 2008.)

The Great Commodities Debate with Larry Swedroe and Rick Ferri
A long multi-part series on HardAssetsInvestor about the role of commodities within a portfolio. Should you add them to your asset allocation? Swedroe and Ferri flesh out their arguments in a moderated battle, and I still don’t know who wins. However, I am glad I didn’t buy commodities the last two years or so when they were in vogue.

Jeremy Grantham / GMO 7-Year Asset Class Forecasts
Each month, Jeremy Grantham and GMO publishes on the web its predictions of the future return for various asset styles over the next seven years. You must register for free on his site to download them. Grantham has gotten increased publicity recently due to how accurate his previous predictions have been. You can read his 2009 Q1 newsletter “The Last Hurrah and Seven Lean Years” without registration. In the end, he’s just another guy with an opinion, but at least he is forthright about it.

Breakdown: The Credit CARD Act of 2009
Cap of StopBuyingCrap has a nice concise list of the changes to credit card laws coming in February 2010, in case you didn’t feel like reading the entire thing. It will be interesting to see how this shakes out. I think that rumors of annual fees or eliminating grace periods for people who don’t carry balances are just scare tactics by credit card lobbyists. They’ll continue to make money from merchant transaction fees, as always.

Google PowerMeter
An online tool that monitors your home’s power usage in real time. Currently only available in very limited areas where people have the right “smart meters” already installed. Sounds even cooler than my Kill-a-Watt energy meter.

My Money Blog has partnered with CardRatings and may receive a commission from card issuers. Some or all of the card offers that appear on this site are from advertisers and may impact how and where card products appear on the site. MyMoneyBlog.com does not include all card companies or all available card offers. All opinions expressed are the author’s alone, and has not been provided nor approved by any of the companies mentioned.

MyMoneyBlog.com is also a member of the Amazon Associate Program, and if you click through to Amazon and make a purchase, I may earn a small commission. Thank you for your support.


Should I Buy Gold Now To Hedge Against Future Inflation?

My Money Blog has partnered with CardRatings and may receive a commission from card issuers. Some or all of the card offers that appear on this site are from advertisers and may impact how and where card products appear on the site. MyMoneyBlog.com does not include all card companies or all available card offers. All opinions expressed are the author’s alone.

Due to the current market conditions, many investors are wondering if investments in gold should be added to their portfolios to hedge against future inflation risks. In the video below (direct link), author Larry Swedroe discusses why he thinks gold is not an appropriate hedge against inflation, as well as some alternative investments.

The debate about gold will probably continue on for eternity, but I tend to lean towards his analysis because gold is too volatile for my tastes. I do like the idea of keeping some physical gold bullion as a hedge against economic collapse, but not as ETFs taking up a huge chunk of my portfolio. I would rather have something that would fit into traditional asset allocations plans, providing both stability and a good (but not perfect) hedge against inflation. So let’s explore the recommended alternatives:

In tax-advantaged accounts like IRAs, Swedroe instead recommends Treasury Inflation-Protected Securities (TIPS) which adjust with the Consumer Price Index (CPI). For this, I have bought shares of the Vanguard Inflation-Protected Securities Fund (VIPSX). I could buy individual funds directly from the government at no cost, but for now I like the simplicity. I even increased my allocation recently.

In taxable accounts, he recommends highly-rated municipal bonds with a relatively short average maturity of 3-5 years. For this, I am looking to buy shares of the Vanguard Limited-Term Tax-Exempt Fund (VMLTX). It is currently about 83% AA/AAA rated municipal bonds, and keeps a maturity of between 2 and 6 years (currently 2.8). The yield is currently a tax-exempt 2.12%, and it has a low expense ratio of 0.20%. If inflation does rise, the yield should rise to keep up.

I’m actually surprised he didn’t bring up commodities funds here as well, which I’ve seen him recommend as insurance against unexpected severe inflation.

My Money Blog has partnered with CardRatings and may receive a commission from card issuers. Some or all of the card offers that appear on this site are from advertisers and may impact how and where card products appear on the site. MyMoneyBlog.com does not include all card companies or all available card offers. All opinions expressed are the author’s alone, and has not been provided nor approved by any of the companies mentioned.

MyMoneyBlog.com is also a member of the Amazon Associate Program, and if you click through to Amazon and make a purchase, I may earn a small commission. Thank you for your support.


More Lessons From The 2008 Financial Markets

My Money Blog has partnered with CardRatings and may receive a commission from card issuers. Some or all of the card offers that appear on this site are from advertisers and may impact how and where card products appear on the site. MyMoneyBlog.com does not include all card companies or all available card offers. All opinions expressed are the author’s alone.

Larry Swedroe, principal of an asset management company and investment book author, also posted his Lessons That 2008 Taught Us In 2008 on SeekingAlpha. It was a nice compilation that covered a variety of topics from active management to Madoff to your “Plan B”.

Here are some excerpts of a few lessons involving investing and your portfolio:

Don’t forget that companies that managed money themselves were often the victims this year!

Lesson 1: Neither investment banks nor other active managers (including hedge funds) can protect investors from bear markets. […]

If their money managers could protect you, why did firms like Lehman Brothers and Bear Stearns go belly up and Merrill Lynch have to be rescued by Bank of America? It is in the best interest of these firms to manage their risks well. Yet, they have clearly demonstrated that they cannot. As evidence of their lack of ability to forecast events consider that in 2008 Lehman spent $751 million buying back its own stock at an average price of $49.60 and Merrill Lynch spent $5.27 billion buying back its stock in 2007 at an average price of $84.88.(2)

Lots of other historically renowned and recommended active managers had a bad year as well.

Lesson 6: One of the more persistent myths is that active managers can protect you from bear markets. In 2008, the hardest hit sector was financial stocks. Financials comprise a significant portion of the asset class of value stocks. As benchmarks for the active managers we can use the Vanguard Small Value Index Fund that lost 32.1 percent and the Vanguard (Large) Value Fund that lost 36.0 percent.

The following is a list of the returns of some of the actively managed mutual funds with superstar value managers, four of whom were named by Morningstar in June 2008 as their recommendations to run value superstars, their recommendations (those are noted with *): Legg Mason Value Trust lost 55.1 percent; *Dodge & Cox lost 44.3 percent; Dreman Concentrated Value lost 49.5 percent; *Weitz Value lost 40.7 percent; *Schneider Value lost 55.0 percent; and *Columbia Value and Restructuring lost 47.6 percent.

Of course, some actively managed value funds beat those benchmarks. However, how would you have known ahead of time which ones they would be?

Some did guess this would happen. But was it luck or skill?

Lesson 9: There is a great likelihood that each time there is a crisis, some guru will have forecasted it with amazing accuracy. But that ignores two important facts. The first problem is that even blind squirrels occasionally will find acorns. In other words, there are tens of thousands of gurus making forecasts all the time.

My Money Blog has partnered with CardRatings and may receive a commission from card issuers. Some or all of the card offers that appear on this site are from advertisers and may impact how and where card products appear on the site. MyMoneyBlog.com does not include all card companies or all available card offers. All opinions expressed are the author’s alone, and has not been provided nor approved by any of the companies mentioned.

MyMoneyBlog.com is also a member of the Amazon Associate Program, and if you click through to Amazon and make a purchase, I may earn a small commission. Thank you for your support.


Why Sports Betting and Stock Picking Are Similar

My Money Blog has partnered with CardRatings and may receive a commission from card issuers. Some or all of the card offers that appear on this site are from advertisers and may impact how and where card products appear on the site. MyMoneyBlog.com does not include all card companies or all available card offers. All opinions expressed are the author’s alone.

So how did everyone do in their March Madness pool? In the book Wise Investing Made Simple by Larry Swedroe, there is a great explanation of why stock-picking is very difficult which incorporates sports betting. I’ll try to briefly paraphrase the idea here.

Sports Betting Basics
Let’s stick with college basketball. Earlier this season, Duke played Cornell. If you were simply betting on who was to win beforehand, most people familiar with basketball would pick Duke. Duke has won national championships, has a top-ranked recruiting class, has a famous coach, has better record against stronger opponents.

But, nobody in Vegas or any sports book will take that bet. Instead, you have an adjustment called the point spread. In this case, the spread was 30 points. Now you have to either bet that Duke will beat Cornell by more or less than 30 points. This is much harder.

How was this 30 point spread determined? By the collective opinion of the other gamblers! It is a common misconception that you are betting against the casino. Nope, the point spread constantly moves so that half of all bettors are on either side of the spread. By the time the game is over, the casino doesn’t care who wins. The casinos simply take the bets, pay off the winners, and walk away with their commission. (You have to bet $11 to win $10.) Great deal, huh?

Because of this point spread and commissions, it is very difficult to make consistent money betting on sports. How many professional sports bettors do you know of? A historical study of NBA games showed that the average difference between point spreads and the actual differences in score was less than 1/4 of one point! The collective opinion of gamblers turns out to be very good.

In other words, with the handicap of the point spread, you could bet on Cornell every year and still come out the same as betting on Duke each year. (This year, Duke only won by 13.) When this is true, it is called an efficient market.

Picking Stocks
When people say “buy a company with a strong brand, a wide moat, and good growth prospects”, it is like saying one should just bet on Duke to win. It’s simply not that easy. There is a handicap, but instead of a point spread it is the price of the stock.

A good company will be priced at a premium. For example, people may love eBay, Apple, or Google and think it’s the best business company ever. But at the price you have to pay (the market price), you’re not betting that eBay will be successful, you’re betting if eBay will be more successful than the collective market participants think it will be based on all the information currently available. Again, the data shows that beating this collective prediction is very unlikely.

The argument over whether you can get better risk-adjusted returns from picking individual stocks will probably go on forever. Is it skill? Is it luck? Either way, it is important to know that very few people pull it off over the long term, and I think this analogy illustrates one major reason why. Next time you feel like stock picking, try beating the spread on 10 different sports events first. 🙂

My Money Blog has partnered with CardRatings and may receive a commission from card issuers. Some or all of the card offers that appear on this site are from advertisers and may impact how and where card products appear on the site. MyMoneyBlog.com does not include all card companies or all available card offers. All opinions expressed are the author’s alone, and has not been provided nor approved by any of the companies mentioned.

MyMoneyBlog.com is also a member of the Amazon Associate Program, and if you click through to Amazon and make a purchase, I may earn a small commission. Thank you for your support.


Weekend Links: Snowflakes And More

My Money Blog has partnered with CardRatings and may receive a commission from card issuers. Some or all of the card offers that appear on this site are from advertisers and may impact how and where card products appear on the site. MyMoneyBlog.com does not include all card companies or all available card offers. All opinions expressed are the author’s alone.

Here are some more links from my weekend reading:

Nina of Queercents found out the hard way that Home Equity Lines of Credit (HELOCs) can be revoked! It was done because her property value had dropped significantly, which makes sense. But not only was it through no adverse action of her own, she had to pay closing costs and various other fees upfront. A classic case of heads I win, tails you lose.

NCN of No Credit Needed has been blogging about living without credit and getting out of debt for two years now. You can read virtually all he knows about debt reduction here.

Heard of the debt snowball? Jaimie of PaidTwice explains the related concept of debt snowflakes. Via Get Rich Slowly.

Pinyo of Moolanomy shares an interview with author Larry Swedroe. I’ve actually got two of his books sitting on my desk right now – the newer Wise Investing Made Simple and the classic The Only Guide to a Winning Investment Strategy You’ll Ever Need. Too bad all this house-buying stuff is getting in the way of me reading them!

My Money Blog has partnered with CardRatings and may receive a commission from card issuers. Some or all of the card offers that appear on this site are from advertisers and may impact how and where card products appear on the site. MyMoneyBlog.com does not include all card companies or all available card offers. All opinions expressed are the author’s alone, and has not been provided nor approved by any of the companies mentioned.

MyMoneyBlog.com is also a member of the Amazon Associate Program, and if you click through to Amazon and make a purchase, I may earn a small commission. Thank you for your support.


How Often Should I Rebalance My Investment Portfolio? A Brief Article Review

My Money Blog has partnered with CardRatings and may receive a commission from card issuers. Some or all of the card offers that appear on this site are from advertisers and may impact how and where card products appear on the site. MyMoneyBlog.com does not include all card companies or all available card offers. All opinions expressed are the author’s alone.

I feel like my last post about rebalancing wasn’t as thorough as I’d have liked it to be, so here I go again, adding some quick definitions and including a review of several research articles about the subject.

What is Rebalancing?
Let say you examine your risk tolerance and decide to invest in a mixture of 70% stocks and 30% bonds. As the years go by, your portfolio will drift one way or another. You may drop down to 60% stocks or rise up to 90% stocks. The act of rebalancing involves selling or buying shares in order to return to your initial stock/bond ratio of 70%/30%.

Why Rebalance?
Rebalancing is a way to maintain the risk/reward ratio that you have chosen for your investments. In the example above, doing nothing may leave you with a 90% stock/10% bond portfolio, which is much more aggressive than your initial 70%/30% stock/bond mix.

In addition, rebalancing also forces you to buy temporarily under-performing assets and sell over-performing assets (buy low, sell high). This is the exact opposite behavior of what is shown by many investors, which is to buy in when something is hot and over-performing, only to sell when the same investment becomes out of style (buy high, sell low).

However, in taxable accounts, rebalancing will create capital gains/losses and therefore tax consequences. In some brokerage accounts, rebalancing will incur commission costs or trading fees. This is why, if possible, it is a good idea to redirect any new investment deposits in order to try and maintain your target ratios.

How Often Should I Rebalance My Portfolio?
Some people rebalance on a certain time-based schedule – for example, once every 6-months, every year, or every 2 years. Others wait until certain asset classes shift a certain amount away from their desired targets before taking any action. A good source of research articles about which method is optimal can be found at the AltruistFA Reading Room. I’ve been reading through them the past few days, and I’ll try to provide a very general overview of the articles here.

So what is best? You may be surprised by the fact that not only is there no clear agreement on the answer to this question, but many of the articles actually contradict each other! For instance, compare this Journal of Investing article:

Over this period, regular monthly rebalancing returns dominated less active approaches. Should one infer that daily rebalancing is better still? Our data cannot say, but it seems plausible.

with this excerpt from an Efficient Frontier article:

So, what can we conclude from all this? Monthly rebalancing is too frequent. There are small rewards to increasing one’s rebalancing frequency from quarterly up to several years, but this comes at the price of increased portfolio risk.

Eh? I believe that this is because their results vary significantly with the time period chosen and asset classes being used in their back-tested scenarios.

Then there is this paper from Financial Planning magazine, which used the 25 year period from Oct. 1977-Sept. 2002 and a 60% Stock (S&P 500 Index) and 40% Bond (Lehman Bros. Gov’t Index) as the starting/target allocation. Here are the results for various rebalancing frequencies:

altext

The various rebalancing periods showed minimal performance differences, although annual rebalancing held a slight return margin and a higher risk margin.

Because the risk-adjusted performance differences among the portfolios were small, the answer to the question of when to rebalance–monthly, quarterly, semi-annually, or annually–depends mainly on the costs to the investor of rebalancing.

Efficient Frontier’s Bernstein also agreed in the this last respect, stating “The returns differences among various rebalancing strategies are quite small in the long run.”

In the “wait for a significant shift before taking action” camp is author Larry Swedroe, who I think also presents a very reasonable solution. From a WSJ article:

With major holdings like U.S. stocks, foreign stocks and high-quality U.S. bonds, consider rebalancing whenever your fund holdings get five percentage points above or below your targets, suggests Larry Swedroe, research director at Buckingham Asset Management in St. Louis. For instance, if you have 40% earmarked for bonds, you would rebalance if your bonds got above 45% or fell below 35%.

Meanwhile, for smaller positions in sectors like emerging markets and real-estate investment trusts, Mr. Swedroe recommends a 25% trigger. So if you have 5% targeted for emerging-market stocks, you’d rebalance if emerging markets balloon above 6.25% or fall below 3.75%. “You definitely want to be rebalancing, but you don’t want to be doing it too often,” Mr. Swedroe says. “You want to let stocks go up a bit before you sell, but not so much that you lose control of risk.”

Summary
Since it seems that there is no concrete right answer, I think the most important thing is to just make sure you set up some way to rebalance that does not involve any emotions or market timing. Don’t worry about the details, but don’t let your portfolio run off on its own either. I think the subtitle of one of the articles above sums it up quite well… ‘Tis Better To Have Rebalanced Regularly Than Not At All.

I have personally chosen to rebalance annually. This method keeps it simple while still controlling risk and offering potential extra return. If I recall correctly, it is also recommended in Ferri’s book All About Asset Allocation (review).

My Money Blog has partnered with CardRatings and may receive a commission from card issuers. Some or all of the card offers that appear on this site are from advertisers and may impact how and where card products appear on the site. MyMoneyBlog.com does not include all card companies or all available card offers. All opinions expressed are the author’s alone, and has not been provided nor approved by any of the companies mentioned.

MyMoneyBlog.com is also a member of the Amazon Associate Program, and if you click through to Amazon and make a purchase, I may earn a small commission. Thank you for your support.


June 2007 Investment Portfolio Snapshot: Paralysis By Analysis, Call For Suggestions

My Money Blog has partnered with CardRatings and may receive a commission from card issuers. Some or all of the card offers that appear on this site are from advertisers and may impact how and where card products appear on the site. MyMoneyBlog.com does not include all card companies or all available card offers. All opinions expressed are the author’s alone.

I haven’t posted my investment portfolio since April, mainly because it hasn’t really changed much. But here’s another snapshot:

6/07 Portfolio Breakdown
 
Retirement Portfolio
Fund $ %
FSTMX – Fidelity Total Stock Market Index Fund $15,132 19%
VIVAX – Vanguard [Large-Cap] Value Index $14,567 18%
VISVX – V. Small-Cap Value Index $14,251 18%
VGSIX – V. REIT Index $8,163 10%
VTRIX – V. International Value $8,686 11%
VEIEX – V. Emerging Markets Stock Index $8,929 11%
VFICX – V. Int-Term Investment-Grade Bond $7,616 10%
BRSIX – Bridgeway Ultra-Small Market $2,126 3%
Cash none
Total $79,470
 
Fund Transactions Since Last Update
Bought $1,000 of FSTMX on 6/26/07 (23.759 shares)

Thoughts
Another couple of months have gone by, and my desire to re-define my asset allocation remains unfulfilled. All I did was buy some more of a Total US Market fund (FSTMX) through my self-employed 401(k). You’d think someone who writes about money on a daily basis would be on top of such things!

But really, I think I might actually be spending too much time on this. As Jack Bogle has stated, “The greatest enemy of a good plan is the dream of a perfect plan.” There is no perfect asset allocation, and I know that. I keep telling myself, I’m not looking for the perfect plan, just a better one which has been well-reasoned out, and one which I should have little reason to tinker with for a long time.

To achieve such a better plan, I have been re-reading each of my favorite investing books on top of many new ones (including All About Index Funds by Ferri, Unconventional Success by Swensen, Only Guide to a Winning Bond Strategy You’ll Ever Need by Swedroe), looking at their research, comparing their model portfolios, and trying to balance all the advice given. But after all these months, my slow deliberation has really just turned into what academics call “paralysis by analysis” and have been just been putting off making a decision for weeks. I do have some overall changes planned, including:

  • Increasing my allocation to international assets,
  • Decreasing my value tilt, and
  • Increasing my bond allocation.

I want to avoid trying to time the market, or chasing recent performance. But I also don’t want to base my decisions on simply trying to avoid the impression of trying to time the market. Although I’m always open to suggestions, I feel I need to some fresh input. Got an asset allocation suggestion? Ideas on a better value/size/country tilt? Another book to read? Throw it at me.

My Money Blog has partnered with CardRatings and may receive a commission from card issuers. Some or all of the card offers that appear on this site are from advertisers and may impact how and where card products appear on the site. MyMoneyBlog.com does not include all card companies or all available card offers. All opinions expressed are the author’s alone, and has not been provided nor approved by any of the companies mentioned.

MyMoneyBlog.com is also a member of the Amazon Associate Program, and if you click through to Amazon and make a purchase, I may earn a small commission. Thank you for your support.