Search Results for: feed

State Farm Homeowner Policyholders: Free Ting Electrical Fire Sensor + $1,000 Repair Credit

If you have State Farm homeowner’s insurance, check to see if you are eligible for a free Ting smart sensor that monitors your home’s electrical wiring for faults that can lead to fires. Three years of Ting service is included, which includes a $1,000 credit toward the cost of a licensed electrician to find and fix hazards found by Ting. Their press release states that electrical fires make up approximately 13% of all home fires.

Some of these preventive detections included sensing clear arcing signals isolated to a chandelier in master bathroom, identifying a missing neutral connection in a sub-panel, and detecting arcing signals consistent with water interaction with electrical system.

Qualified customers who enroll will receive:

– Free Ting sensor with mobile app access
– Pay no annual service fees for three years (fees paid by State Farm)
– Receive $1,000 credit toward remediation of electrical fire hazards (provided by Whisker Labs)

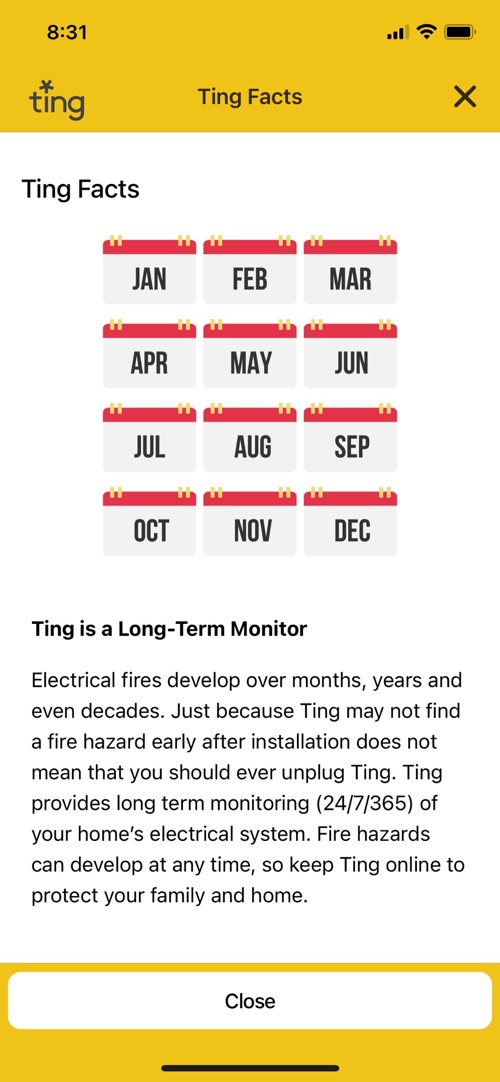
What happens after the 3rd year? Before the end of the 3rd year, State Farm will notify you if the program will be extended as-is, changed, or discontinued. No payment information is requested at the time of enrollment, and you can cancel at any time. There is no obligation to continue the service.

Do all hazards identified by Ting require a licensed electrician for mitigation? In many cases, remediation of the hazard simply means stopping the use of an offending device, such as a heating blanket, sump pump, lamp, or pet feeder (all of these are real examples, among many more). In other cases, a hazard requires professional remediation.

Hat tip to DoC, as I did not receive en e-mail regarding this even though I am eligible and have since gotten and installed my free sensor.

Currently available in the following states:

Alabama
Arizona
Arkansas
California
Colorado
Connecticut
Florida
Georgia
Hawaii
Idaho
Illinois
Indiana
Iowa
Kentucky
Maine
Massachusetts
Mississippi
Missouri
Montana
Nevada
New Hampshire
Ohio
Oklahoma
Pennsylvania
Rhode Island
South Carolina
Texas
Utah
Vermont
Virginia
Washington
Washington, DC
West Virginia

My experience. Enrollment was quick and easy, and the sensor arrived from Ting within a few days. Installation was also quick and easy; just install the app and everything is done via Bluetooth and WiFi within a couple of minutes. Right now, it is is “learning mode” and analyzing my home’s electrical wiring. It will be reassuring to know that there is no obvious electrical fire hazard lurking in my (old) home.

Myth: It Took 25 Years to Recover From 1929 Stock Market Crash

Sometimes, it pays to scratch a little beneath the surface. In 2012, well-known behavioral scientist Dan Ariely published a paper that found that when people signed an honesty declaration at the beginning of a form, rather than the end, they were less likely to lie. It since has been cited in more than 400 other academic papers. Nine years later, a group of anonymous researchers at Data Colada actually looked at the data and found it clearly fudged using copy-and-paste and a random number generator. (They have to be anonymous to avoid retribution.) Dan Ariely and the other authors have since retracted the paper and disavowed any prior knowledge of the fake data.

You may have heard that it took 25 years for the stock market to recover during the Great Depression. I’ve heard it and simply accepted it as truth, until today. It’s true that the Dow Jones Industrial Average (DJIA or just “Dow”) peaked at 381.17 on September 3rd, 1929. It is also true that the DJIA did not reach that level of 381.17 again until November 23rd, 1954. That is a span of over 25 years.

However, as this 2009 NY Times article by Mark Hulbert explains, that’s not the whole story when you dig a little deeper.

[…] a careful analysis of the record shows that the picture is more complex and, ultimately, far less daunting: An investor who invested a lump sum in the average stock at the market’s 1929 high would have been back to a break-even by late 1936 – less than four and a half years after the mid-1932 market low.

The truth is that it took about 7 years for an investor to recover (1929-1936), even if they invested all their money at the very peak. This came 4.5 years after the Dow hit its period low of 41.22 in the middle of 1932. Why?

  • Dividends. Back then, dividend yields were much higher. The absolute dividend payout did not drop nearly as severely as the prices. When the Dow hit a low of 41.22 on July 8, 1932 (that 90% drop you’ve read about), the dividend yield was close to 14%.
  • Deflation. “The Great Depression was a deflationary period. And because the Consumer Price Index in late 1936 was more than 18 percent lower than it was in the fall of 1929, stating market returns without accounting for deflation exaggerates the decline.” Every dollar actually bought significantly more in 1936 than in 1929.
  • Human misjudgment. The DJIA is composed of 30 stocks, which are picked by humans to represent the broad market. According to this article, a total of 18 companies were swapped in and out of the DJIA between 1929 to 1932. That was the highest number of changes to the Dow ever in such a short amount of time. This was a stressful time, and the Dow committee often “sold low” and “bought high” when picking companies to remove and add.

The Great Depression was still an extraordinarily painful time with minimal social safety nets, followed closely by World War II. I recommend reading The Great Depression: A Diary by Benjamin Roth for a vivid picture of what it felt like to live through the Great Depression.

In normal times the average professional man makes just a living and lives up to the limit of his income because he must dress well, etc. In times of depression he not only fails to make a living but has no surplus capital to buy stocks and real estate. I see now how important it is for the professional man to build up a surplus in normal times.

Even today, how many are prepared for the stock market to go down for 2.5 years and then take another 4.5 years to get back to even?

[5/9/1932] Those men who were wise enough to sell during the boom and then keep their funds liquid in the form of government bonds, etc. were not farsighted enough or patient enough to wait almost three years to re-invest. Most of them re-invested a year or more ago and now find stock prices have sagged to 1/3 of what they were when they thought they were buying bargains.

Still, 7 years is very different than 25 years. Imagine being 50 years old and your IRA contribution at 25 years old is still underwater! The worst time period for stock market returns was actually 1972-1982, when it took roughly 10 years to recover if you invested at the peak:

[…] according to a Hulbert Financial Digest study of down markets since 1900, the average recovery time is just over two years, when factors like inflation and dividends are taken into account. The longest was the recovery from the December 1974 low; it took more than eight years for the market to return to its previous peak, which was reached in late 1972.

None of this, of course, guarantees that stocks will have a quick recovery from the market decline that began in October 2007. But it suggests that the historical record isn’t as bleak as it looks.

Announcement: NEW New E-mail Newsletter Service!

As previously mentioned, Feedburner/Google is shutting down their e-mail service permanently as of July 1st, 2021 (very very soon!). I thought that switching over to a new provider would be easy (and free), but I was mistaken. After additional testing and feedback, I have decided against using Follow.it and instead am switching to the paid Feedblitz service instead, which includes no banner ads and faster updates. Email updates will now come directly from “jonathan@mymoneyblog.com”.

For existing Feedburner e-mail subscribers, I have already imported your e-mails to the new Feedblitz service. In fact, you should be receiving this post via Feedblitz. Ideally, this means you don’t won’t have to do anything and things will simply keep working as they did before.

If you use RSS, please update your feeds to https://www.mymoneyblog.com/feed for unfiltered direct access.

If you signed up for Follow.it, you will need to re-subscribe to the Feedblitz service below. I have deleted the Follow.it list completely and you should no longer receive any e-mails from them. I don’t even have access to the e-mails myself. I apologize for the inconvenience.

If you are receiving this e-mail and have previously unsubscribed and/or I have added you in error, please accept my sincere apologies!! 😞 I did a manual export and crossed my fingers. This is the first and only time that I have exported my e-mail list to another service in the 16+ years of this blog’s existence, and I hope to not have to do it for another 16 years! 😅 Unsubscribing is easy and quick. There should be a link at the bottom of every single e-mail to “Safely Unsubscribe”.

Free Updates via E-mail
If you’d like to be automatically sent an e-mail when a new post is published (roughly every weekday), please enter your e-mail address in the form below (or click here). I’ll never use your email address for any other purpose, and you can unsubscribe at any time.

As always, thank you for reading. I truly believe that I have some of the most intelligent, discerning finance readers in the world, and I have learned so much through our interactions throughout the years.

p.s. I know that some of you also get e-mails directly from WordPress, and that should continue to work for those that wish to keep using it, but please know that unfortunately the WordPress service does NOT send out an email if it is a previously-published post that I have updated with new information. For that reason, WordPress not my recommended option. The Feedblitz service includes both my updated and refreshed posts.

Happiness Illusions: 5 Surprising Things That Don’t Make You As Happy As You Think

I’ve managed to reach Week 3 of the free Yale Happiness Course (it was 50/50 that I’d quit by now), and I’ve been pleasantly surprised so far. I like to think that I’ve read most of these “happiness” tips, but there were several new bits that were new to me. The “rewirement” activities have also been helpful in improving my mood, albeit only temporarily for now. It’s almost like putting on “happiness” sunscreen, where the protection lasts for a few hours but tends to fade away. (Must reapply regularly via gratitude journal!)

As if in direct response to my curiosity regarding their Happiness Test Questions, this week addressed most of the missing question topics (I didn’t look ahead, promise!). Here are just a few selected examples from the course slideshow and video materials.

Money. If you ask someone making $40k a year what income they think would make them happy, they’ll say $60k a year. But if you ask someone making $60k a year what income they think would make them happy, they’ll say $100k a year. Ask someone making $100k a year what income they think would make them happy, they’ll say $250k a year.

This chart includes a few different ways to approximate “happiness”: having a positive affect, not being blue, and not being stressed. The charts all show that the overall trend is that higher income does make a difference at lower levels, but the effect mostly wears off as you get to higher incomes above roughly $75k in todays dollars.

Although this new study shows happiness increasing past $75k/year, the overall curve still behaves similarly – as your income grows the incremental increase in happiness from more become smaller and smaller.

Physical Beauty. A study showed that people who entered a weight-loss program and lost weight actually ended up more depressed than those that didn’t lose weight. In fact, every group tended to feel worse after finishing the program, possibly because they all had to focus on how unsatisfied they were with their weight.

Marriage. A study found that there was a temporary bump in happiness in the couple of years before getting married through a couple of years after getting married, but after that you pretty much return to your previous level of happiness. Marriage by itself doesn’t seem to keep you happy forever.

Awesome Stuff. If only my problems could be solved by clicking on “Add to Cart”.

Life Happens, or “Luck”. You find yourself permanently disabled from a car accident. You win the lottery. The book The How of Happiness by Sonja Lyubomirsky looks at the research and makes the case that only 10% of your overall happiness is dictated by your life circumstances.

People do tend to have a “happiness thermostat”, but it is not everything:

Our intentional, effortful activities have a powerful effect on how happy we are, over and above the effects of our set points and the circumstances in which we find themselves. – Sonja Lyubomirsky

Bottom line. These things most likely will make you happier to some extent or at least temporarily, they just aren’t the final answer. Got a higher-paying job? Great, but you’ll probably want even better one very soon. If all you want is money, you’ll never have enough money. If all you want is physical beauty, you’ll never feel beautiful enough. If you think stuff will make you happy, you’ll never have enough stuff. How can we get to “enough”?

Another observation is that money/beauty/stuff/couplehood is easily displayed on social media, which pushes us even further way from “enough”. Someone on your feed will always appear to have more money, be more beautiful, own cooler stuff, or be in the perfect relationship. The truly important things are harder to show off. Being absorbed in your daily activities and being able to spend time on the things you find important. Loving others and feeling loved back. Feeling yourself to be valuable. Feeling grateful for what you already have. Feeling supported by your relationships.

Giving Tuesday 2020: Double Your Impact With Matching Donations

givingtuesdayTuesday, December 1st is Giving Tuesday 2020, an international day about giving support through charities and nonprofits by donating money or volunteering your time. In case you aren’t inundated with mailings already, this time of year is a big deal for charities, with 40% of donations occurring in the last six weeks of the year. Here are some ways you can “double your impact” with a matching donation.

Facebook Match (good toward any charity that accepts donations via Facebook). Starting at 8am Eastern on 12/1, Facebook will match $7 million in donations to U.S. nonprofits – up to $100,000 per nonprofit and $20,000 per donor. Donations will be matched for the first $2M, 10% for the next $5M.

For example, give directly with the donate button on the The Humane Society Facebook Page. You can also start your own fundraiser here or simply post up a donate button to support your favorite charity.

Check for an employer match. Try this lookup tool from DoubleTheDonation. Most of these programs don’t require you to actually give on a specific day, but you may want to start the process today so you don’t forget in the holiday rush.

Individual charities. Many charities are organizing their own matching program for #GivingTuesday. Here are some large charities have organized their own matches in the past, but I would check to make sure.

Also check with your favorite local community nonprofit. GivingTuesday.org has some additional ideas.

Having trouble deciding where to give? Here are some charity comparison sites that will help you pick where to send your help.

  • CharityNavigator – Largest and well-publicized charity rating site, provides a 4-star rating based primarily on financial criteria.
  • GiveWell – Tries to identify the best charities, not rate them all. Focused primarily on charities working internationally
  • GreatNonProfits – Allows clients, volunteers, and funders to post personal reviews based on their experiences.
  • GuideStar – Tries to be a one-stop shop for both financial data and personal reviews of charities. Must register to see a lot of things, and pay a subscription fee for premium in-depth data.

Looking to volunteer your time? Check out FeedingAmerica.org and find a volunteer opportunity at a food bank near you.

Subscribe To My Money Blog

Daily Updates via E-mail
If you’d like to be automatically sent an e-mail when a new post is published (roughly every weekday), please enter your e-mail address in the form below. I’ll never use your email address for any other purpose, and you can unsubscribe at any time.


Facebook and Twitter
I don’t really use Facebook, and so my Facebook page is rather sad and neglected. I used to be able to push a daily update automatically, but unfortunately that functionality broke. You can still follow me on Twitter and get a tweet whenever a new post is up.


RSS Feed
I still use RSS to read articles, even though that may technically make me a dinosaur. The URL for my RSS feed is https://www.mymoneyblog.com/feed.

Born to Run: Is Running Outdoors Another Deeply-Embedded Human Desire?

Recently, I’ve been attracted to books that talk about common qualities of all humans (as opposed to their differences) – like how humans became the dominant species because of their ability to cooperate (Sapiens) and our shared need for autonomy, competence, and community (Tribe). I’m not an avid runner, but Born to Run: A Hidden Tribe, Superathletes, and the Greatest Race the World Has Never Seen by Christopher McDougall suggests that running is another link in that story. Perhaps this ability to run for long distances (extended outdoor exercise) is another way we can achieve a better balance of our mental, physical, and spiritual selves.

The specific race tale in the book is also suspenseful and exciting (once you get past the slow beginning), making this is a recommended read for that reason alone. I don’t want to give spoilers, so here are some highlights that focus on a better life – which of course is the ultimate goal of financial freedom.

The Tarahumara are an indigneous people that live a secluded life in the Sierra Madre canyons of Mexico. They are known for their running ability, but perhaps they aren’t special, but just the ones that have managed to keep what was once a common skill? Put another way – Why do so many people love running?

That was the real secret of the Tarahumara: they’d never forgotten what it felt like to love running. They remembered that running was mankind’s first fine art, our original act of inspired creation.

Know why people run marathons? he told Dr. Bramble. Because running is rooted in our collective imagination, and our imagination is rooted in running. Language, art, science; space shuttles, Starry Night, intravascular surgery; they all had their roots in our ability to run. Running was the superpower that made us human-which means it’s a superpower all humans possess.

“And you’ve got to ask yourself why only one species in the world has the urge to gather by the tens of thousands to run twenty-six miles in the heat for fun,” Dr. Bramble mused. “Recreation has its reasons.”

And like everything else we love – everything we sentimentally call our “passions” and “desires” – it’s really an encoded ancestral necessity. We were born to run; we were born because we run. We’re all Running People, as the Tarahumara have always known.

Human bodies are actually well-suited for distance running. Not running fast, but running for an extended time, longer than most other mammals. Some of our ancestors hunted by simply chasing and outlasting an animal until it collapsed in exhaustion. Perhaps ultra-marathoners are not so unusual after all.

Ethnographers’ reports he’d read years ago began flooding his mind; they told of African hunters who used to chase antelope across the savannahs, and Tarahumara Indians who would race after a deer “until its hooves fell off.” Lieberman had always shrugged them off as tall tales, fables of a golden age of heroes who’d never really existed. […] You don’t even have to go fast, Lieberman realized. All you have to do is keep the animal in sight, and within ten minutes, you’re reeling him in. If a middle-aged professor can outrun a dog on a hot day, imagine what a pack of motivated hunter-gatherers could do to an overheated antelope.”

The best shoes are the worst. This book is a bit of an antidote to the memoir of Nike founder Phil Knight Shoe Dog (which I still enjoyed). What if thick-soled wedge shoes aren’t really solving a problem, just prolonging it?

Bowerman’s marketing was brilliant. “The same man created a market for a product and then created the product itself,” as one Oregon financial columnist observed. “It’s genius, the kind of stuff they study in business schools.” Bowerman’s partner, the runner-turned-entrepreneur Phil Knight, set up a manufacturing deal in Japan and was soon selling shoes faster than they could come off the assembly line.

“Every great cause begins as a movement, becomes a business, and turns into a racket.”

The Tarahumara run long distances on thin sandals. Perhaps we need more of the posture-improving feedback and foot-strengthening from running barefoot:

The way to activate your fat-burning furnace is by staying below your aerobic threshold-your hard-breathing point-during your endurance runs. Respecting that speed limit was a lot easier before the birth of cushioned shoes and paved roads; try blasting up a scree-covered trail in open-toed sandals sometime and you’ll quickly lose the temptation to open the throttle. When your feet aren’t artificially protected, you’re forced to vary your pace and watch your speed: the instant you get recklessly fast and sloppy, the pain shooting up your shins will slow you down.

Like many other ancient cultures, the Tarahumara have a strong sense of and hospitality. When we help each other without expectation, it makes everyone’s life better.

“The Raramuri have no money, but nobody is poor,” Caballo said. In the States, you ask for a glass of water and they take you to a homeless shelter. Here, they take you in and feed you. You ask to camp out, and they say, “Sure, but wouldn’t you rather sleep inside with us?”

Also like many other ancient cultures, eating a primarily plant-based diet gives you all the nutrition you need and lets your body’s natural feedback system tell you when to stop eating. Engineered junk food like Cheetos/Doritos dust and super-sweet everything are designed to keep your body always wanting more. Chia seeds are the natural “energy food” of the Tarahumara tribe.

The first step toward going cancer-free the Tarahumara way, consequently, is simple enough: Eat less. The second step is just as simple on paper, though tougher in practice: Eat better. Along with getting more exercise, says Dr. Weinberg, we need to build our diets around fruit and vegetables instead of red meat and processed carbs. Anything the Tarahumara eat, you can get very easily,” Tony told me. “It’s mostly pinto beans, squash, chili peppers, wild greens, pinole, and lots of chia.”

Outdoor exercise just seems to make you happier:

“Such a sense of joy!” marveled Coach Vigil, who’d never seen anything like it, either. “It was quite remarkable.” Glee and determination are usually antagonistic emotions, yet the Tarahumara were brimming with both at once, as if running to the death made them feel more alive.

I knew aerobic exercise was a powerful antidepressant, but I hadn’t realized it could be so profoundly mood stabilizing and-I hate to use the word-meditative. If you don’t have answers to your problems after a four-hour run, you ain’t getting them.

“Just move your legs. Because if you don’t think you were born to run, you’re not only denying history. You’re denying who you are.”

Finding happiness is often about wanting less (which has the nice side effect of spending less). Nothing mentioned in this book requires a brand-name consumer product or a huge net worth. Run or walk, preferably outdoors, preferably with other people. If you have back or knee problems, try switching gradually to something closer to barefoot (thinner, flatter soles) but keep on walking outside with friends. Eat mostly plants, or at least more plants. Look to help other people. I might also try going for a jog…

Money in Excel Review – Good For Budget Tracking, Bad For Investments

Thanks to generous assistance from a reader, I was able to spend some time poking around the new Money in Excel template for Microsoft 365 Personal or Family subscribers. Does it fulfill its promise of helping you “see all your financial accounts in one place, make a plan, and reach your financial goals”? Here’s my rundown of the features that were included and those that were missed.

Accounts Toolbar. After following the clear installation instructions, you can add your various financial accounts using the toolbar on the right-hand side. (I just connected a few secondary accounts for review purposes.) Plaid is used for account aggregation, where you provide your login and passwords and they use that to grab your account balances and transaction history. This data import feeds the rest of the Excel worksheet, but the panel itself is a useful at-a-glance snapshot of your finances. The feel is very similar to the “Overview” page on the Intuit Mint app.

Customized Categories. In the “Categories” worksheet, you can create and edit the names of custom categories used to organize your transactions. For example, I added “Charitable Giving”. You can’t edit the original, default categories.

Transactions. You then move onto the “Transactions” worksheet, where you can edit the categories assigned to each specific imported transaction. If you have a lot of transactions across different bank and credit card accounts, this provides a handy aggregate view of everything together.

Spending analysis. For the most part, this template is about budgeting and spending. Once have all your transactions imported and categories, it will generate some basic charts and provide some simple insights into your expenses. Here are some examples:

  • Spending breakdown by category
  • Current vs. previous month spending
  • Cumulative spending over the month
  • Net worth calculation (assets minus liabilities)
  • Top merchant: Where did you spend the most money?
  • Bank fees: How much are you paying in fees?
  • Subscriptions: Where are your recurring expenses?

This is all useful for someone trying to understand their spending and developing their own budgeting system, but it’s definitely not groundbreaking. Mint.com has providing this type of service for many years. The main differences are that there are no pesky advertisements inside your own Excel worksheet, while the Mint smartphone app may be more convenient.

Missing: Holdings, asset allocation, performance tracking. I am able to connect to an investment account, but it only shows me the total dollar balance. That’s it, as far as I can tell. There is no data on individual holdings, no asset allocation breakdown, no performance tracking.

Missing: Investment transaction list. I am not able to see historical buy/sell transactions on a simple view-only basis, like on the credit card side. It would be nice just to see the last 10 transactions, for example.

There are other portfolio spreadsheets where you can manually input ticker symbols and share counts and they’ll pull in market quotes, but that doesn’t adjust for events like dividends, stock splits, and dividend reinvestment. I was hoping to create a single portfolio spreadsheet using the imported data cells from my brokerage accounts, one that would provide a live view of all my investment accounts, but also allow me to manipulate those data in order to determine if/when to rebalance my portfolio.

For now, I will have to stick with my existing system using both Personal Capital and a custom Google Spreadsheet to track my investment holdings. The Personal Capital financial tracking app (free, my review) automatically logs into my accounts, adds up my balances, tracks my performance, and calculates my asset allocation. Then, I use my manual Google Spreadsheet (free, instructions) to help me calculate how much I need in each asset class to rebalance back towards my target asset allocation.

Bottom line. The “Money in Excel” template for Microsoft 365 Family and Personal subscribers is a free, basic template that imports your spending transactions across different bank and credit card accounts. It can help you with monthly budgeting, but not much beyond that. I hope that in the future they expand it to investment accounts and allow you to have more control over your data. It would also be nice if they made it free for everyone with access to Excel, not just Microsoft 365 Family and Personal subscribers.

Free Social Security Tool for Optimal Benefit Claiming Strategy

Update: The free Open Social Security tool has been updated to include a new “heat map” visualization that illustrates the relative values of claiming Social Security at different ages. Details here. Here is a sample graph for a couple with similar income histories and the same age:

For this situation, we see that the worst expected outcomes would occur if both individuals claimed really early. The best expected outcomes occur when one claims relatively early and the other claims relatively late.

Original post:

socialsecuritycardWhen to start claiming Social Security to maximize your potential benefit can be a complicated question, especially for couples. There are multiple paid services that will run the numbers for you, including Social Security Solutions (aka SS Analyzer) and Maximize My Social Security, which cost between $20 and $250 depending on included features.

Mike Piper of Oblivious Investor has created a free, open-source calculator called Open Social Security. To use the calculator, you will need to your Primary Insurance Amount (PIA). This amount depends on your future income, so I would first consult this other free Social Security benefit estimator tool to more easily estimate your PIA. I believe the value you see at SSA.gov assumes that you will keep working at your historical average income until your claiming age (which won’t be the case for us).

Here are our results as a couple, assuming we were the same age (we are close) and with my expected benefit being slightly higher than hers:

The strategy that maximizes the total dollars you can be expected to spend over your lifetimes is as follows:

You file for your retirement benefit to begin 12/2047, at age 70 and 0 months.
Your spouse files for his/her retirement benefit to begin 4/2040, at age 62 and 4 months.

The present value of this proposed solution would be $657,749.

Basically, the tool says that my wife should apply as soon as possible, while I should claim as late as possible. I believe this is because this scenario allows us claim at least some income starting from 62, and if I die first after that, my wife would still be able to “upgrade” to my higher benefit.

The tool might take some time to run the calculations, depending on your browser. You can learn more and provide feedback at Bogleheads and Github.

I am not a Social Security expert, and am not qualified to speak to the accuracy of the results. However, Mr. Piper is the author of the highly-rated book Social Security Made Simple, has a history of doing thorough work, and the tool has been around a while now. If I were close to 62, I would probably also use the paid services for a second and third opinion. Why? Spending $100 now could save you many thousands in the future.

The best thing about this free tool is that it can introduce a lot of people to ideas that they would have not otherwise considered. Even if it lacks every bell or whistle, being free means it can help more people. Many spouses wouldn’t think of having one claim as early as possible (age 62), and then have the other claim as late as possible (age 70). It’s not common sense unless you understand the inner workings of Social Security.

Giving Tuesday Now – May 5th, 2020 #GivingTuesdayNow

On the Tuesday after each Thanksgiving and Black Friday, Giving Tuesday is an international day about giving support through charities and nonprofits by donating money and goods or volunteering your time. The same organization has created Giving Tuesday Now on Tuesday, May 5th, 2020 in response to the global threat of COVID-19.

On the last GivingTuesday, December 3, 2019, the global giving day generated $2 billion in giving, just in the United States, and inspired millions of people worldwide to volunteer, perform countless acts of kindness, and donate their voices, time, money, and goods. The additional giving day planned for May 5, 2020 is being deployed in response to needs expressed by communities and leaders around the world.

People can show their generosity in a variety of ways during #GivingTuesdayNow–whether it’s helping a neighbor, advocating for an issue, sharing a skill, or giving to causes, every act of generosity counts.

I looked over the various charity comparison websites to see if they had any COVID-19 updates. GiveWell recommends to keep giving to their same top charities as before. GreatNonProfits has updated their top-rated guide for 2020, but it’s not COVID-specific. CharityNavigator does have a section on “highly-rated nonprofits providing relief and recovery to communities impacted by the pandemic”. You can also donate directly to the COVID-19 Response Fund of Feeding America, or they also have a tool to find a local food bank near you. I ended up donating to this last one.

(We recently set up a Fidelity donor-advised fund for this, but the value dropped so we mostly gave from our usual funds until the balance came back up.)

Hopefully, your favorite nonprofit has a special donation page and maybe even a match going on that you are able to support. Alternatively, they might be organizing special activities where you can donate some of your time. Many people have already spending their time and energy giving back in various ways and it has been great to see.

Why You (Still) Shouldn’t Bet on Higher Oil Prices Using the USO ETF

Updated for crazy 2020. The big news yesterday was that one measure of crude oil prices actually went negative, because futures were coming due and nobody had any place to store the oil upon delivery.

Why did this happen? Part of the reason is that too many people had the following plan:

  1. Crude oil has dropped to $18 a barrel. These prices are multi-decade lows.
  2. Oil prices must go up again… eventually… right? Look at that historical chart!
  3. The futures market is kinda complicated… I know! I’ll buy an ETF like USO.
  4. Profit!?!?

Here are a few things you should know first about the United States Oil Fund (USO) and similar oil ETPs.

You aren’t the only one who’s thought of this. Billion of dollars have come and gone into oil ETFs in the past few years. Here are articles from 2014 and 2015 when oil dropped to below $50 a gallon after being over $100:

In April 2020, USO ended up having to actually change how the ETF operated in order to avoid some the market distortions that the speculation caused.

The usual market timing questions apply. Sure, the price will go up, but how long is “eventually”? It might be 1,3,5, or 10 years. If you have a specific time-frame in mind, then you can go out on the futures market and then buy a specific contract. But if oil hasn’t risen enough at that time – maybe it peaked earlier and dropped, or it peaks further in the future – you’ll have lost money.

If you buy the ETF, when is a good time to sell? $40 a barrel? $80? $100? What if you sell and then it rises another 50%?

What if it takes a while? The longer you have to hold these ETFs, the less likely they will track the price of oil (see below). Meanwhile, the ETF provider is happily collecting their annual expense ratios of 0.50% to 1%. At the current asset level of $4 billion times the 0.45% management fee, that’s $18 million a year in fees.

Your commodities futures ETF may not track the price of oil very well at all. To properly track the price of oil, you’d need to buy some oil and store it somewhere (and pay storage and security costs). These ETFs don’t do that, instead they buy oil futures contracts and keep rolling them over into new ones when they expire. That’s not the same thing. USO is designed to track daily price movements in the price of oil, not long-term movements!

Oil prices doubled from in 2009-2010. USO went nowhere. Visually, here’s a chart from Attain Capital that compares the change in USO share price (purple) as compared to the spot price of crude oil (red) when oil prices doubled between the start of 2009 and the end of 2010 (blue line adjusts USO underperformance for roll costs):

uso1

From the Bloomberg article above:

Since USO launched in April 2006, it has returned -71 percent, while the spot price of oil returned -26 percent. The last time oil roared back from a bottom was in 2009, when it returned 78 percent on the year. USO returned just 14 percent.

If you don’t understand the terms “backwardation”, “contango”, and “roll costs” then you don’t understand commodities futures. If you don’t understand something, you probably shouldn’t buy it. The more people crowd into this trade, the weirder the futures markets get. Who would think that you could get paid to take oil from someone? Take it straight from a USO executive:

John Hyland, chief investment officer of USO, says the fund is a “tactical trading vehicle predominately used by professional traders,” and not meant to be a buy-and-hold investment.

In the end, such a play is a speculative bet and it may just pay off, who knows. But it certainly isn’t a wise investment, especially if the tool you’re using doesn’t even do what you want it to do.

Giving Tuesday 2019: Double Your Impact With Matching Donations

givingtuesdayTuesday, December 3rd is Giving Tuesday 2019, an international day all about giving support through charities and nonprofits by donating money and goods or volunteering your time. In case you aren’t inundated with mailings already, this time of year is a big deal for charities, with 40% of donations occurring in the last six weeks of the year. Here are some ways you can “double your impact” with a matching donation.

Facebook Match (good toward any charity that accepts donations via Facebook). Starting at 8am Eastern on 12/3, Facebook and PayPal will match $7 million in donations to U.S. nonprofits – up to $100,000 per nonprofit and $20,000 per donor. Donations will be matched dollar for dollar on a first-come, first-served basis. All processing fees will be paid so 100% of your donation goes to charity.

For example, give directly with the donate button on the The Humane Society Facebook Page. You can also start your own fundraiser here or simply post up a donate button to support your favorite charity.

Check for an employer match. Try this lookup tool from DoubleTheDonation. Most of these programs don’t require you to actually give on a specific day, but you may want to start the process today so you don’t forget in the holiday rush.

Individual charities. Many charities are organizing their own matching program for #GivingTuesday. Here are some large charities have organized their own matches in the past, but I would check to make sure.

Also check with your favorite local community nonprofit. GivingTuesday.org has a local database.

Having trouble deciding where to give? Here are some charity comparison sites that will help you pick where to send your help.

  • CharityNavigator – Largest and well-publicized charity rating site, provides a 4-star rating based primarily on financial criteria.
  • GiveWell – Tries to identify the best charities, not rate them all. Focused primarily on charities working internationally
  • GreatNonProfits – Allows clients, volunteers, and funders to post personal reviews based on their experiences.
  • GuideStar – Tries to be a one-stop shop for both financial data and personal reviews of charities. Must register to see a lot of things, and pay a subscription fee for premium in-depth data.
  • Philanthropedia – Ranks non-profits based on opinions of experts, and groups them to mutual fund-like portfolios.

Looking to volunteer your time? Check out FeedingAmerica.org and find a volunteer opportunity at a food bank near you.