Here’s the October 2013 update for my Beat the Market Experiment, a series of three portfolios started on November 1st, 2012:
- $10,000 Passive Benchmark Portfolio that would serve as both a performance benchmark and an real-world, low-cost portfolio that would be easy to replicate and maintain for DIY investors.
- $10,000 Beat-the-Benchmark Speculative Portfolio that would simply represent the attempts of an “average guy” who is not a financial professional and gets his news from mainstream sources to get the best overall returns possible.
- $10,000 P2P Consumer Lending Speculative Portfolio – Split evenly between LendingClub and Prosper, this portfolio is designed to test out the alternative investment class of person-to-person loans. The goal is again to beat the benchmark by setting a target return of 8-10% net of defaults.
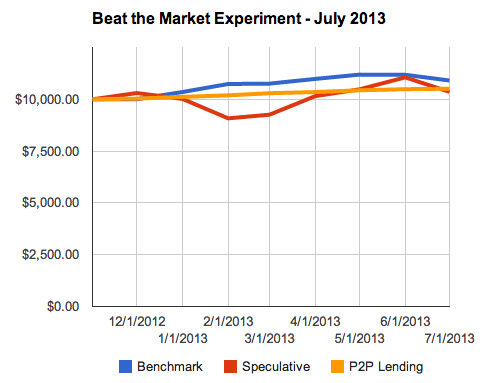
As requested, I updated the scale to zoom in on the comparison chart.
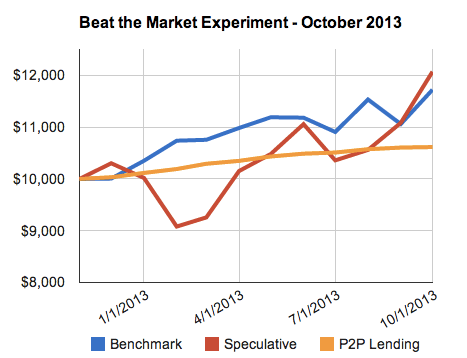
Summary. 11 months into this experiment, the Benchmark and Speculative portfolios are both up between 15-20%. The Speculative portfolio is actually winning now ($12,071 vs. $11,723). I sold all my AAPL shares in September. Both P2P portfolios continue to earn interest and are still on pace for an 8%+ annual return, but the growth rate has slowed lately as late loans have been taking a toll. Values given are after market close October 1, 2013.
$10,000 Benchmark Portfolio. I put $10,000 into index funds at TD Ameritrade due to their 100 commission-free ETF program that includes free trades on the most popular low-cost, index ETFs from Vanguard and iShares. With no minimum balance requirement, no maintenance fees, and no annual fees, I haven’t paid a single fee yet on this account. The portfolio was based loosely on a David Swensen model portfolio with a buy-hold-rebalance philosophy. Portfolio value is $11,723. Screenshot of holdings below:

 Halfway Update – 5 Years Later! Carol Loomis has posted the 5-year update in Fortune of the $1,000,000 index fund vs. hedge fund bet. Halfway through the 10-year bet (1/1/08 to 12/31/17), the Vanguard S&P 500 index fund backed by Buffett is up by 8.69%. The group of hedge funds hand-picked by Protégé Partners are up by 0.13%. Note that the index fund had been lagging just about ever year since this one, but that’s why we are looking at a longer period. Consider this halftime. 🙂
 The Best Credit Card Bonus Offers – March 2024
 Big List of Free Stocks from Brokerage Apps
 Best Interest Rates on Cash - March 2024
 Free Credit Scores x 3 + Free Credit Monitoring
 Best No Fee 0% APR Balance Transfer Offers
 Little-Known Cellular Data Plans That Can Save Big Money
 How To Haggle Your Cable or Direct TV Bill
 Big List of Free Consumer Data Reports (Credit, Rent, Work)