Search Results for: swensen

Thank You, David Swensen, For These Important Investing and Life Lessons

My Money Blog has partnered with CardRatings and may receive a commission from card issuers. Some or all of the card offers that appear on this site are from advertisers and may impact how and where card products appear on the site. MyMoneyBlog.com does not include all card companies or all available card offers. All opinions expressed are the author’s alone.

unconventional180I was saddened to hear the news of the passing of David Swensen, a well-known investor, endowment fund manager, and educator. From the NY Times obituary:

David Swensen, a money manager who gave up a lucrative Wall Street career to oversee Yale University’s endowment and proceeded to revolutionize endowment investing, in the process making Yale’s the best-performing fund in the country over a 20-year period, died on Wednesday in New Haven, Conn. He was 67.

In addition to “revolutionizing” endowment investing, he also wrote a book for the average individual investor called Unconventional Success: A Fundamental Approach to Personal Investment which I read at a very formative period in my investing education. Even though he is best known for being an early adopter of alternative asset classes like hedge funds, private equity, and direct real estate ownership farmland and timber, he recommended something different for those without the time, skill, and existing money (access). From an interview with the Yale Alumni magazine:

That’s why the most sensible approach is to come up with specific asset allocation targets that you can implement with low-cost, passively managed index funds and rebalance regularly. You’ll end up beating the overwhelming majority of participants in the financial markets.

Here is a brief summary of the important lessons that I learned from his book:

Alignment of interests is key. There are many conflicts of interest in the financial world. Learning to spot them is an important skill. For example, in terms of asset classes, owning shares of businesses (equities) are good because your interests are aligned as a shareholder. However, in the case of high-yield bonds, your interests are not aligned. The borrower wants the lowest interest rate possible, so their job is to seem as safe as possible even if there are significant hidden risks. This is why Swensen recommends sticking only with FDIC-insured cash and Treasury bonds (nominal and TIPS). Take your risks as an owner.

Stick with these six core asset classes. Swensen identified core asset classes that you should invest in. These share three main characteristics:

  1. They rely on market-generated returns, not from active management skill (as it is a very rare attribute and hard to separate from luck).
  2. They add a valuable and differentiable characteristic to a portfolio.
  3. They come from broad, highly-liquid markets.

The six core asset classes he identified are:

  • US Equity
  • Foreign Developed Equity
  • Emerging Market Equity
  • Real Estate
  • U.S. Treasury Bonds
  • U.S. Treasury Inflation-Protected Securities (TIPS)

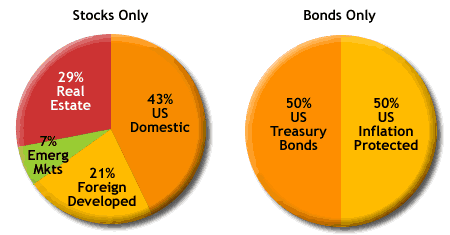
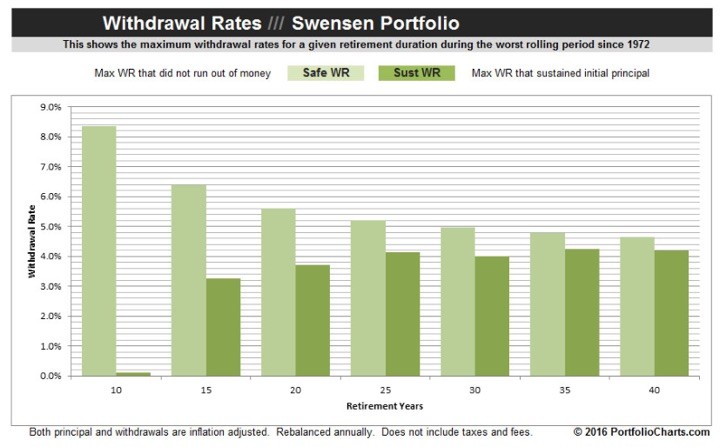
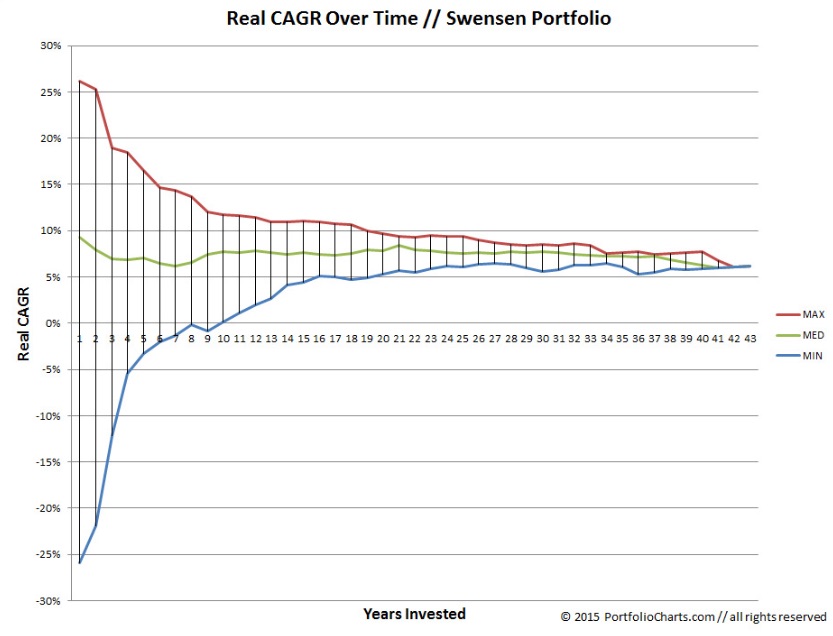
Swensen shared this sample model portfolio asset allocation:

30% Domestic US Equity
15% Foreign Developed Equity
10% Emerging Markets
15% Real Estate
15% U.S. Treasury Bonds
15% Inflation-Protected Securities

This also meant he was recommending against investing in the following:

  • US Corporate Bonds
  • High-Yield “Junk” Corporate Bonds
  • Asset-Backed Securities (like mortgage-backed bonds)
  • Tax-Exempt Bonds
  • Foreign Bonds
  • Hedge Funds
  • Private Equity

Not that they are horribly bad, it’s just that you don’t need them. They either have increased risk that isn’t adequately compensated, added management fees and costs that aren’t adequately compensated, or aren’t different enough to add extra return. Don’t make things more complex without a good reason.

Tips on active management. If you still want to pay someone to pick stocks for you, he recommended looking for the following in a manager:

  • Hold a limited number of stocks. Bet boldly on fewer companies (high “active share”), as opposed to being a “closet index fund”.
  • High rate of internal investment. The managers should have a high percentage of their own net worth in the same funds that they ask you to invest in. They should “eat their own cooking.”
  • Limit assets under management. If there is more money flowing in than they can invest efficiently, they should close the fund to avoid asset bloat. This requires them to turn down more money!
  • Reasonable management fees. Active management hash higher internal costs than a passive strategy, but you can still charge less than average.

Money isn’t everything. Find a purpose. Finally, David Swensen walked the walk. He could have made billions by staying on Wall Street instead of moving to Yale. He could have made tons of money being a “money guru” on CNBC, etc. The guy didn’t even bother to publish a second edition or “revised” edition of his book, even though that would have also been easy money. He found a mission. More quotes from Swenson (same NYT article):

Mr. Swensen was particularly proud of how the growing endowment had helped the university contribute to financial aid.

“One of the things that I care most deeply about is that notion that anyone who qualifies for admission can afford to go to Yale, and financial aid is a huge part of what the endowment does,” he said in an interview for this obituary in 2014.

“People think working for something other than the most money you could get is an odd concept, but it seems a perfectly natural concept to me.”

My Money Blog has partnered with CardRatings and may receive a commission from card issuers. Some or all of the card offers that appear on this site are from advertisers and may impact how and where card products appear on the site. MyMoneyBlog.com does not include all card companies or all available card offers. All opinions expressed are the author’s alone, and has not been provided nor approved by any of the companies mentioned.

MyMoneyBlog.com is also a member of the Amazon Associate Program, and if you click through to Amazon and make a purchase, I may earn a small commission. Thank you for your support.


Swensen Portfolio 10-Year Trailing Returns Redux

My Money Blog has partnered with CardRatings and may receive a commission from card issuers. Some or all of the card offers that appear on this site are from advertisers and may impact how and where card products appear on the site. MyMoneyBlog.com does not include all card companies or all available card offers. All opinions expressed are the author’s alone.

Here is a check-in on the trailing 10-year total returns for the David Swensen model portfolio, courtesy of ETFPM.com. Last update was in 2011. As a reminder, here is the model portfolio asset allocation with representative ETFs:

30% Domestic US Equity (VTI)
15% Foreign Developed Equity (VEA)
10% Emerging Markets (VWO)
15% Real Estate (VNQ)
15% U.S. Treasury Bonds (IEF)
15% Inflation-Protected Securities (TIP)

The chart below shows the growth of $1,000 invested this way and rebalanced annually (eMAC), starting from January 2003 until the end of March 2013. eMAC stands for “efficent multi-asset class”.

Again, we see that this low-cost, diversified index fund portfolio (+169%) has done well over the last 10.3 years, besting the S&P 500 (+118%) handily as well as the Dow Jones Credit Suisse Hedge Fund Index (not shown anymore, but +95% roughly). We also see that a 30% Stock, 70% Long-term Treasury bond portfolio does pretty well, but I tend to dismiss that as rearview-mirror investing. Yes, looking backward it did well, but I doubt you could find any portfolio manager telling their clients to hold 30% Stocks and 70% Long-Term Treasuries as a long-term portfolio during the period between 2003-2007.

My Money Blog has partnered with CardRatings and may receive a commission from card issuers. Some or all of the card offers that appear on this site are from advertisers and may impact how and where card products appear on the site. MyMoneyBlog.com does not include all card companies or all available card offers. All opinions expressed are the author’s alone, and has not been provided nor approved by any of the companies mentioned.

MyMoneyBlog.com is also a member of the Amazon Associate Program, and if you click through to Amazon and make a purchase, I may earn a small commission. Thank you for your support.


Swensen Portfolio 10-Year Total Returns: Low-Cost Diversified ETF Portfolio Results

My Money Blog has partnered with CardRatings and may receive a commission from card issuers. Some or all of the card offers that appear on this site are from advertisers and may impact how and where card products appear on the site. MyMoneyBlog.com does not include all card companies or all available card offers. All opinions expressed are the author’s alone.

Last week, I shared a chart that showed how a diversified portfolio that was rebalanced regularly still managed to nearly double in value over the last decade. Here’s another similar finding based on the David Swensen portfolio as compiled by an advisor group called ETF Portfolio Management.

Swensen manages the Yale University endowment and wrote an excellent investment book called Unconventional Success (my review) directed towards individual investors. Even though he does active management himself, he explains why low costs and low turnover are critical, how certain asset class are better than others, and why rebalancing regularly is important. He ends up providing a model portfolio made up of what he calls “Core” asset classes. Here’s the slightly updated David Swensen Portfolio with his recommended 70% stocks / 30% bonds breakdown. Actual low-cost index ETFs are included via ticker symbols.

30% Domestic US Equity (VTI)
15% Foreign Developed Equity (VEA)
10% Emerging Markets (VWO)
15% Real Estate (VNQ)
15% U.S. Treasury Bonds (IEF)
15% Inflation-Protected Securities (TIP)

Instead of the Total Bond Index from last week, which include everything from Treasuries to corporate bonds to mortgage-backed securities, the Swensen bond allocation only has nominal and inflation-linked Treasury bonds. The chart below shows the growth of $1,000 invested this way (eMAC) at the start of 2001 until the end of July 2011. (Last week’s chart included the start of 2000 to end of 2009.) The ETFs listed above were bought and rebalanced annually. eMAC stands for “efficent multi-asset class”.

Again, we see that the diversified and rebalanced portfolio has done well over the last 10 years, more than doubling in value. Check out their annual returns breakdown (summarized below), and you can see how in any single year different asset classes will have different returns. Some go up, some stay steady, some go down. This lack of strong correlation is what helps smooth out your portfolio, and makes you feel better that at least something is doing okay at any given time.

Now, this may not be the ideal portfolio going forward. Nobody knows the future, you can only do what you think gives you the best odds for success. But it does serve as another real-world example of how low-cost diversification works and that you should have good reasons for holding each of the asset classes that you buy.

(The “HF Index” indicated stands for the Dow Jones Credit Suisse Hedge Fund Index, which claims to track ~8,000 hedge funds and thus tracks overall hedge fund performance. After poking around their website, the returns seem to be net of manager fees.)

My Money Blog has partnered with CardRatings and may receive a commission from card issuers. Some or all of the card offers that appear on this site are from advertisers and may impact how and where card products appear on the site. MyMoneyBlog.com does not include all card companies or all available card offers. All opinions expressed are the author’s alone, and has not been provided nor approved by any of the companies mentioned.

MyMoneyBlog.com is also a member of the Amazon Associate Program, and if you click through to Amazon and make a purchase, I may earn a small commission. Thank you for your support.


David Swensen’s Updated Model Asset Allocation

My Money Blog has partnered with CardRatings and may receive a commission from card issuers. Some or all of the card offers that appear on this site are from advertisers and may impact how and where card products appear on the site. MyMoneyBlog.com does not include all card companies or all available card offers. All opinions expressed are the author’s alone.

If you don’t know the name David Swensen, he is an investment manager who is best know for managing Yale Universities huge endowment. What makes him interesting is that even though he does invest in some hedge funds and private equity, he doesn’t believe that the common investor should try to emulate this. An excerpt from a recent interview in the Yale Alumni Magazine sums it up:

That’s why the most sensible approach is to come up with specific asset allocation targets that you can implement with low-cost, passively managed index funds and rebalance regularly. You’ll end up beating the overwhelming majority of participants in the financial markets.

In his 2005 book Unconventional Success: A Fundamental Approach to Personal Investment, he proposed a model asset allocation using what he believes are the 6 “core asset classes” that an individual investor should own:

Unconventional Success Model Portfolio Breakdown

Asset Allocation For 70% Stocks/30% Bonds (with ETF examples)
30% Domestic Equity (VTI, IYY)
15% Foreign Developed Equity (EFA, VEA)
5% Emerging Markets (VWO, EEM)
20% Real Estate (VNQ, ICF)
15% U.S. Treasury Bonds (SHY, IEF)
15% Inflation-Protected Securities (TIP, IPE)

But in the Yale interview, he proposes a slight change that reduced real estate exposure in exchange for increased emerging markets holdings:

Today, Swensen says, economic conditions might call for a modest revision. He now recommends that investors have 15 percent of their assets in real estate investment trusts, and raise their investment in emerging-market stock funds to 10 percent.

This interview was printed in March/April 2009, so I’m not sure if you could call this performance chasing or not. I don’t follow his model asset allocation exactly anyway – I think the best idea is to read his excellent book and find out his reasoning for holding each asset class. The exact weightings you can hash out later. It definitely added another dimension to my investing views.

My Money Blog has partnered with CardRatings and may receive a commission from card issuers. Some or all of the card offers that appear on this site are from advertisers and may impact how and where card products appear on the site. MyMoneyBlog.com does not include all card companies or all available card offers. All opinions expressed are the author’s alone, and has not been provided nor approved by any of the companies mentioned.

MyMoneyBlog.com is also a member of the Amazon Associate Program, and if you click through to Amazon and make a purchase, I may earn a small commission. Thank you for your support.


Model Portfolio #7: Unconventional Success by David Swensen

My Money Blog has partnered with CardRatings and may receive a commission from card issuers. Some or all of the card offers that appear on this site are from advertisers and may impact how and where card products appear on the site. MyMoneyBlog.com does not include all card companies or all available card offers. All opinions expressed are the author’s alone.

This model portfolio is taken from Unconventional Success by David Swensen. As mentioned before, Swensen is not a personal financial advisor, but is a respected institutional money manager who currently runs the Yale Endowment. In his book for individual investors, he writes that there are only a limited number of core asset classes in which one should invest in. Although he avoids giving specific asset allocation guidance, he does provide an “outline of a well-diversified, equity-oriented portfolio”, which is shown below.

Unconventional Success Model Portfolio Breakdown (Hurrah, I found my software disks so I can make pretty pie charts again!)

Asset Allocation For 70% Stocks/30% Bonds (with ETF examples)
30% Domestic Equity (VTI, IYY)
15% Foreign Developed Equity (EFA, VEA)
5% Emerging Markets (VWO, EEM)
20% Real Estate (VNQ, ICF)
15% U.S. Treasury Bonds (SHY, IEF)
15% Inflation-Protected Securities (TIP)

Commentary
There is a healthy portion devoted to real estate in the portfolio. The common way to track this asset class with REITs, which are considered a domestic stock. Instead of taking up less than 5% of the US stock market by capitalization, it is now taking up more than 40% of the domestic equity portion. I’m not really sure why there is so much, although he does write that if you own your home or other real estate, you may want to reduce your REIT exposure.

In addition, corporate and mortgage-backed bonds are left out, following his opinion that they aren’t the most desirable asset classes for individual portfolios due to added call risk and credit risk. (If you’ve been keeping up with the markets recently, it seems he may have been on to something here.)

As with all the model portfolios, the idea here isn’t just to follow any of them blindly. I do think it helps to see where different experts have similar components to their model portfolios, and where they differ. I also like breaking it down this way into pie charts of stocks-only and bonds-only in order to visualize them better.

See here for other model portfolios from respected sources, part of my incomplete Rough Guide to Investing.

My Money Blog has partnered with CardRatings and may receive a commission from card issuers. Some or all of the card offers that appear on this site are from advertisers and may impact how and where card products appear on the site. MyMoneyBlog.com does not include all card companies or all available card offers. All opinions expressed are the author’s alone, and has not been provided nor approved by any of the companies mentioned.

MyMoneyBlog.com is also a member of the Amazon Associate Program, and if you click through to Amazon and make a purchase, I may earn a small commission. Thank you for your support.


Tether Reserves Breakdown: A Clear Example of Stablecoin Risk

My Money Blog has partnered with CardRatings and may receive a commission from card issuers. Some or all of the card offers that appear on this site are from advertisers and may impact how and where card products appear on the site. MyMoneyBlog.com does not include all card companies or all available card offers. All opinions expressed are the author’s alone.

Tether is the largest US dollar stablecoin in the world, with a market cap of about $58 billion. Stablecoins are supposed to be backed by an equal amount of fiat money held in a trust account. 1 USDT should be backed by $1 USD. But how do you know? Tether just released a report outlining the collateral backing its stablecoin as of 3/31/2021, and it’s…. a huge warning sign. Less than 7% is held in cash and Treasury bills, with the rest being a mix of vague commercial paper, loans to unknown entities, and honestly who-knows-what.

Alignment of interest. Keep in mind the concept of alignment of interest from David Swensen. Tether wants to seem as credible and legitimate and “NOT A SCAM” as possible. Everything they say will try to put them in the best light possible. In fact, Tether is only doing this because of a legal settlement with the New York Attorney’s General Office after being fined $18 million for lying in the past. (As recently as March 2019, Tether claimed it was backed by 100% USD cash.) Yet… this is the best they can do?

A single glance at this chart and I know that Tether is not taking my US dollar and whisking it away safely into a trust account at a regulated US bank. Instead, the people running Tether are using the collateral for their own personal gain. They are making loans, earning interest, all things that add risk while using other people’s money. Banks are allowed to do that within a highly-regulated environment. Tether is not a bank.

Liquidity risk. There is a reason why Warren Buffett only holds Treasury bills when he says “cash” and not commercial paper. When the poo hits the fan – and it will sooner or later – “cash” means you get your money out immediately and reliably. Tether will not be able to do this, given the composition of its reserves. This op-ed on the future of stablecoins covers a lot of related concerns.

As the volume and velocity of stablecoins grow, the liquidity risk, of course, will grow too. For this reason, it will become increasingly important for the banks managing stablecoin cash to be nonlending banks or perhaps liquid asset banks that ring-fence the investments in segregated, bankruptcy-remote accounts — and, again, invest the assets backing stablecoin deposit liabilities in 100 percent risk-free, short-term, and liquid assets. Indeed, one reason why Wyoming chose its Special Purpose Depository Institution (SPDI) charter to be a nonlending charter is precisely because leverage and digital assets do not mix. Let me pause and repeat that — leverage and digital assets do not mix. Digital assets generally settle in minutes and with settlement finality, which means leveraged financial institutions that handle them could quickly find themselves in trouble if they don’t manage the liquidity risk well — digital assets move fast. So, there’s a fundamental reason why digital assets should interface with the traditional financial system via nonleveraged banks whose demand deposit liabilities are 100 percent backed by risk-free, short-term, liquid assets.

Instead of 100% risk-free, short-term, liquid assets, Tether is less than 7% risk-free, short-term, liquid assets. Commercial paper? Backed by whom exactly? Fiduciary account? At which remote offshore bank owned by a third-party? They could be pointing to a half-eaten sandwich and calling it collateral.

As a result, I would never own Tether, and if such behavior continues to be allowable, it would make me more skeptical of the other stablecoins like USD Coin (USDC) and Gemini Dollar (GUSD), even though they do claim to be fully-backed by dollar reserves in a US Bank. (Gemini and Circle are also regulated by the New York State Department of Financial Services, while Tether is not.) Regulation around stablecoins is so limited that we’ll probably have to experience some sort of major loss event before this gets addressed, just as we had to suffer deposit losses from failed banks before FDIC-insurance came around.

Having a clear stance on cryptocurrencies is tricky. On one hand, it is definitely a “Wild West” situation and there is certainly fraud and shady practices involved. On the other hand, this is how disruption works, and I don’t like anyone confidently telling me the future when nobody knows the future. I would rather try to learn about it, look for opportunities, but also remain very skeptical and careful. If you are holding a lot of Tether, possibly due to the high 8%+ interest rates available, please consider yourself warned.

Also see: Potential Risks of High Interest Stablecoin Savings Accounts

My Money Blog has partnered with CardRatings and may receive a commission from card issuers. Some or all of the card offers that appear on this site are from advertisers and may impact how and where card products appear on the site. MyMoneyBlog.com does not include all card companies or all available card offers. All opinions expressed are the author’s alone, and has not been provided nor approved by any of the companies mentioned.

MyMoneyBlog.com is also a member of the Amazon Associate Program, and if you click through to Amazon and make a purchase, I may earn a small commission. Thank you for your support.


Longleaf Partners Funds Shareholder Letters

My Money Blog has partnered with CardRatings and may receive a commission from card issuers. Some or all of the card offers that appear on this site are from advertisers and may impact how and where card products appear on the site. MyMoneyBlog.com does not include all card companies or all available card offers. All opinions expressed are the author’s alone.

unconventional180One of the early books that impacted my investing philosophy was Unconventional Success: A Fundamental Approach to Personal Investment by David Swensen. As a very successful manager of the Yale Endowment, he offered common-sense explanations of why low-costs are good and which core asset classes make the most sense to own.

In addition, he pointed out the characteristics to look for in successful active management:

  • Hold a limited number of stocks. Bet boldly on fewer companies (high “active share”), as opposed to being a “closet index fund”.
  • High rate of internal investment. The managers should have a high percentage of their own net worth in the same funds that they ask you to invest in. They should “eat their own cooking.”
  • Limit assets under management. If there is more money flowing in than they can invest efficiently, they should close the fund to avoid asset bloat. This requires them to turn down more money!
  • Reasonable management fees. Active management hash higher internal costs than a passive strategy, but you can still charge less than average.

Swensen pointed out Southeastern Asset Management as an example of a company that most clearly displayed all of these characteristics, but don’t miss the last part of the quote:

Southeastern Asset Management (sponsor of the Longleaf Partners mutual-fund family) exemplifies every fundamentally important, investor-friendly characteristic conducive to active-management success. Portfolio managers exhibit the courage to hold concentrated portfolios, to commit substantial funds side by side with shareholders, to limit assets under management, to show sensitivity to tax consequence, to set fees at reasonable levels, and to shut down funds in the face of diminished investment opportunity.

Even though all the signs point in the right direction, investors still face a host of uncertainties regarding Southeastern’s future active-management success.

Due to this recommendation, I try to keep up with the Longleaf Funds shareholder letters. (You can register for free e-mail updates, even if you don’t own their funds.)

Reading the shareholder letters helps illustrate the many difficulties of active management. Here’s how most of their shareholder letters go, along with specific commentary on individual stocks.

  • Our Partners Fund only holds these 15-25 stocks. Our performance has been [x.xx%]. We have done [better/worse] than our benchmarks.
  • We continue to believe we will generate alpha in the future because we only companies at a significant discount to our conservative appraisals.
  • We claim no ability to predict short-term market moves.
  • We believe that our bottom-up intrinsic value investing approach has positioned the Funds with less risk of permanent capital loss than the relevant indices across all of our strategies.

Their flagship Longleaf Partners Fund (LLPFX) has had attractive performance if you look from inception in 1987:

longleaf1987

However, what if you read Swensen’s book when it was popular in 2005 and thought… I should buy some of that! You would have fallen far behind a simple S&P 500 index fund.

longleaf2005

Here’s what Morningstar has to say about it:

Although Longleaf Partners’ 2016 rebound was welcome, past missteps continue to drag down its record and raise concerns about its prospects.

Longleaf again closed their flagship Longleaf Partners Fund (LLPFX) to new investors in June 2017. Their Small Cap fund has been closed to new investors since 1997. This shows that they are still holding true to the positive characteristics listed above. They could make more money by staying open, but they aren’t. Here’s a snippet from their 2017 Q2 Shareholder letter:

The eight-plus year bull market in the U.S. has made finding qualifying opportunities more difficult, particularly in larger cap companies. In addition, this year’s strong returns in most markets outside of the U.S. have made our on-deck list of prospective investments light around the world. Because we have sold and trimmed businesses whose prices have moved closer to our appraisals, our cash reserves are higher than normal. In June, we closed the Longleaf Partners Fund due to limited new investments and a high cash position.

I respect Southeastern Asset Management and I enjoy reading their shareholder letters. They might end up kicking butt in the future. However, I hold no position on any Longleaf funds because I don’t have the level of faith required to maintain my position. It’s a tough world out there, even when you are doing the “right” things. Note that LLPFX charges 0.95% of assets and multiple large-cap index funds only charge 0.05%. Consider that as of this writing, the trailing 15-year total return of LLPFX is 7.12% annualized. The trailing 15-year total return of the S&P 500 is 9.58% annualized. If you held this in a taxable account, the gap would be even wider.

Bottom line. Longleaf Partners Fund continues to be an example of promising characteristics for an investor-friendly, actively-managed mutual fund. However, their recent performance has still been questionable. They may outperform in the future, but will you stick around to see? Reading their free shareholder letters is a good way to learn about what it’s like to invest in a traditional value-oriented, actively-managed strategy.

My Money Blog has partnered with CardRatings and may receive a commission from card issuers. Some or all of the card offers that appear on this site are from advertisers and may impact how and where card products appear on the site. MyMoneyBlog.com does not include all card companies or all available card offers. All opinions expressed are the author’s alone, and has not been provided nor approved by any of the companies mentioned.

MyMoneyBlog.com is also a member of the Amazon Associate Program, and if you click through to Amazon and make a purchase, I may earn a small commission. Thank you for your support.


Reasons For Owning High-Quality Bonds

My Money Blog has partnered with CardRatings and may receive a commission from card issuers. Some or all of the card offers that appear on this site are from advertisers and may impact how and where card products appear on the site. MyMoneyBlog.com does not include all card companies or all available card offers. All opinions expressed are the author’s alone.

pie_flat_blank_200Here are some helpful resources on owning only bonds of the highest credit quality as part of your portfolio asset allocation.

  • David Swensen in his book Unconventional Success argued that alignment of interests is important. With stocks, the exectives want to make profits, and you want them to make profits. With stocks, your interests are aligned. In contrast, the job of bond issuers is to look as creditworthy as possible, even if they are not. This keeps the interest rates they pay lower. With bonds, your interest are not aligned. The safety ratings of bonds usually only get worse – usually quickly and unexpectedly as we saw with subprime mortgages. Ratings agencies are not very good at their jobs, mostly in a reactionary role, and are often paid by the same people they rate.
  • Larry Swedroe at ETF.com:

    However, he also observes that the primary objective of investing, at least in stocks, is to make money. On the other hand, he makes an important distinction when it comes to the primary objective of investing in bonds, which is to help you stay invested in stocks when the inevitable bear markets arrive.

    And that leads to his conclusion to invest the fixed-income portion of your portfolio in only the safest bonds (such as Treasurys, FDIC-insured CDs and municipals rated AAA/AA).

    The overall idea to is own the safest thing possible when it comes to bonds.

  • Daniel Sotiroff at The PF Engineer:

    The primary reason most investors own fixed income securities (bonds) is their ability to limit declines in portfolio value during periods of poor stock performance. From this perspective there is another dimension to safety in the fixed income universe that needs to be understood.

    […] Almost all of the non-Treasury securities experienced a drawdown during 2008 which peaked around October and November. Investors holding corporate bonds, intermediate and longer term municipal issues, and inflation protected securities were no doubt disappointed that their supposedly safe assets posted losses. Corporate bonds in particular have the unfortunate stigma of behaving like stocks during crises. Adding insult to injury those disappointed investors were also faced with taking a haircut on their fixed income returns if they wanted to rebalance and purchase equities at very low prices. Thus there is more to risk than the more academic standard deviation (volatility) of returns.

    My interpretation is that he concludes that intermediate-term Treasury notes are good balance of safety and interest rate risk, while short-term Treasury bills are for those that really don’t want any interest rate risk.

  • Also see this previous post: William Bernstein on Picking The Right Bonds For Your Portfolio
My Money Blog has partnered with CardRatings and may receive a commission from card issuers. Some or all of the card offers that appear on this site are from advertisers and may impact how and where card products appear on the site. MyMoneyBlog.com does not include all card companies or all available card offers. All opinions expressed are the author’s alone, and has not been provided nor approved by any of the companies mentioned.

MyMoneyBlog.com is also a member of the Amazon Associate Program, and if you click through to Amazon and make a purchase, I may earn a small commission. Thank you for your support.


Making Your Nest Egg Last: Safe Withdrawal Rates vs. Sustainable Withdrawal Rates

My Money Blog has partnered with CardRatings and may receive a commission from card issuers. Some or all of the card offers that appear on this site are from advertisers and may impact how and where card products appear on the site. MyMoneyBlog.com does not include all card companies or all available card offers. All opinions expressed are the author’s alone.

eggosReading Warren Buffett’s Annual Letter always reminds me that stocks are not just some numbers that bop up and down, but are shares of real businesses with land, factories, knowledge, and hard-working people. This helps reassure me that the value of those companies taken together will never go to zero, and will eventually rebound and grow over the long term. At the same time, once you stop working and start selling shares, the prospect of going to zero is real. If you combine a prolonged bear market and forced withdrawals at depressed prices, you risk permanently impairing your portfolio.

According to a Merrill Lynch survey of wealthy families with $5+ million (not just people on the street!), 39% of them thought you could spend 6% or more from your portfolio indefinitely. The reality is closer to 3%.

When you see the term safe withdrawal rate, it almost always refers to how much money you can safely withdraw from an investment portfolio each year without running out of money. Usually, this number is set during the first year, and is adjusted annually for inflation. The key phrase is “without running out of money”. You could start out with a $800,000 dollars, but as long as you end with at least $1 and never drop below zero, you’re considered “safe”. In the real world, having your portfolio nosedive while you’re still relatively young may cause you to panic prematurely.

pc_panic

Since I last mentioned PortfolioCharts.com, the creator Tyler has released a new tool called the Withdrawal Rates Calculator. It is quite cool, at least for an asset allocation geek like myself. You can enter your own custom asset allocation, and it will show both the historical safe withdrawal rate and the sustainable withdrawal rate. As defined there, a sustainable withdrawal rate is one where you must end the period with your initial principal amount, for example you must both start and end with $800,000 dollars.

Here are the results for the Classic 60/40 portfolio:

60% Total US Stock Market
40% Total US Bond Market

pc_6040

Here are the results for the Swensen Portfolio, on which my portfolio is loosely based:

30% Total US Stock Market
15% International Developed
5% Emerging Markets
15% 5 Year US Treasuries
15% US TIPS
20% US REIT

pc_swensen

For the Classic 60/40 portfolio, the rough numbers for a 40-year period are 4% for Safe WR and 3.4% for Sustainable WR. For the Swensen portfolio, the rough numbers for a 40-year period are 4.6% for Safe WR and 4.2% for Sustainable WR. If you were to focus on the sustainable numbers, that’s a surprising result of 24% higher withdrawals with the Swensen portfolio (and other asset allocations do even better!)

Can you depend on these historical differences to persist into the future? I would be careful about looking at things too finely, as correlations are always shifting. However, I do prefer using the sustainable withdrawal rate number for my own early retirement planning, and I am thankful to have this tool to tinker with.

(You may also be interested to know that a 100% US stock portfolio, despite its higher historical average returns, has a slightly lower 30-year sustainable withdrawal rate that either of the options above.)

My Money Blog has partnered with CardRatings and may receive a commission from card issuers. Some or all of the card offers that appear on this site are from advertisers and may impact how and where card products appear on the site. MyMoneyBlog.com does not include all card companies or all available card offers. All opinions expressed are the author’s alone, and has not been provided nor approved by any of the companies mentioned.

MyMoneyBlog.com is also a member of the Amazon Associate Program, and if you click through to Amazon and make a purchase, I may earn a small commission. Thank you for your support.


Portfolio Charts Visualization Tool: Returns vs. Time (Holding Period)

My Money Blog has partnered with CardRatings and may receive a commission from card issuers. Some or all of the card offers that appear on this site are from advertisers and may impact how and where card products appear on the site. MyMoneyBlog.com does not include all card companies or all available card offers. All opinions expressed are the author’s alone.

When investing in stocks and bonds, it is important to take a long-term perspective. We’ve all heard that phrase. A new tool called PortfolioCharts.com lets you create charts that make it easier to visualize the relationship between returns and holding periods. Created by a fellow named Tyler, found via The Reformed Broker.

With the Pixel chart, you can customize any asset allocation and see that portfolio mix’s returns over a multitude of timeframes. Here’s the chart for The Swensen Portfolio, which is the closest “lazy portfolio” to my personal portfolio – 30% US Total, 15% Foreign Developed, 5% Emerging Market, 20 US REIT, 15% 5-Year Treasuries, 15% TIPS.

portchart1

You can see that depending on your starting year, the returns over the next 1-9 year period could be pretty rough. But as long as you held for 10 years or more, you always got a positive real return above inflation. You can also see that the often-promised 5% real returns aren’t always guaranteed, although historically if you held on for 20+ years your odds were pretty good.

You may recall a similar style of chart from the NYT and Crestmont Research which includes additional data going back to 1920:

nytcrestmont

My favorite style is the Funnel chart:

The Funnel chart shows the changing uncertainty of compound annual growth rates over time. This demonstrates how long you may need to hold a portfolio to experience the average long-term returns it advertises. It also provides a nice snapshot of the range of 1-year volatility.

Here’s the Funnel for the same Swensen Portfolio:

portchart2

The funnel chart also supports the notion – in an even simpler way – that if you can take a long-term perspective, your risk of losing money should decrease. Here’s a similar chart from the classic investing book A Random Walk Down Wall Street that was one of my early blog posts:

randomwalk_stocktime

Finally, the Hurricane chart allows you to simulate what would have happened to your portfolio balance if you made annual withdrawals, such as in a retirement scenario.

Warren Buffett is another famous supporter of taking the long-term view. From a recent CNBC interview:

Buffett, who looks to buy stocks or business for their long-term prospects, said recent weakness in the market does not concern him.

“Stocks are going to be higher, and perhaps a lot higher 10 years from now, 20 years from now,” he said, adding that’s why he does not try to time the market.

Hopefully for those investors with a long runway ahead of them, this new tool will help you view your portfolio in a more patient manner. I’ll try to remember it when the next market panic arrives.

My Money Blog has partnered with CardRatings and may receive a commission from card issuers. Some or all of the card offers that appear on this site are from advertisers and may impact how and where card products appear on the site. MyMoneyBlog.com does not include all card companies or all available card offers. All opinions expressed are the author’s alone, and has not been provided nor approved by any of the companies mentioned.

MyMoneyBlog.com is also a member of the Amazon Associate Program, and if you click through to Amazon and make a purchase, I may earn a small commission. Thank you for your support.


Global Asset Allocation Book Review: Comparing 12+ Expert Model Portfolios

My Money Blog has partnered with CardRatings and may receive a commission from card issuers. Some or all of the card offers that appear on this site are from advertisers and may impact how and where card products appear on the site. MyMoneyBlog.com does not include all card companies or all available card offers. All opinions expressed are the author’s alone.

gaafaberI am a regular reader of Meb Faber’s online writings, and volunteered to received a free review copy of his new book Global Asset Allocation: A Survey of the World’s Top Asset Allocation Strategies. It is a rather short book and would probably be around 100 pages if printed, but it condensed a lot of information into that small package.

First off, you are shown how any individual asset class contains its own risks, from cash to stocks. The only “free lunch” out there is diversification, meaning that you should hold a portfolio of different, non-correlated asset classes. For the purposes of this book, the major asset classes are broken down into:

  • US Large Cap Stocks
  • US Small Cap Stocks
  • Foreign Developed Markets Stocks
  • Foreign Emerging Markets Stocks
  • US Corporate Bonds
  • US T-Bills
  • US 10-Year Treasury Bonds
  • US 30-Year Treasury Bonds
  • 10-Year Foreign Gov’t Bonds
  • TIPS (US Inflation-linked Treasuries)
  • Commodities (GSCI)
  • Gold (GFD)
  • REITs (NAREIT)

So, what mix of these “ingredients” is best? Faber discusses and compares model asset allocations from various experts and sources. I will only include the name and brief description below, but the book expands on the portfolios a little more. Don’t expect a comprehensive review of each model and its underpinnings, however.

  • Classic 60/40 – the benchmark portfolio, 60% stocks (S&P 500) and 40% bonds (10-year US Treasuries).
  • Global 60/40 – stocks split 50/50 US/foreign, bonds also split 50/50 US/foreign.
  • Ray Dalio All Seasons – proposed by well-known hedge fund manager in Master The Money Game book.
  • Harry Browne Permanent Portfolio – 25% stocks/25% cash/25% Long-term Treasuries/25% Gold.
  • Global Market Portfolio – Based on the estimated market-weighted composition of asset classes worldwide.
  • Rob Arnott Portfolio – Well-known proponent of fundamental indexing and “smart beta”.
  • Marc Faber Portfolio – Author of the “Gloom, Boom, and Doom” newsletter.
  • David Swensen Portfolio – Yale Endowment manager, from his book Unconventional Success.
  • Mohamad El-Erian Portfolio – Former Harvard Endowment manager, from his book When Markets Collide.
  • Warren Buffett Portfolio – As directed to Buffett’s trust for his wife’s benefit upon his passing.
  • Andrew Tobias Portfolio – 1/3rd each of: US Large, Foreign Developed, US 10-Year Treasuries.
  • Talmud Portfolio – “Let every man divide his money into three parts, and invest a third in land, a third in business and a third let him keep by him in reserve.”
  • 7Twelve Portfolio – From the book 7Twelve by Craig Israelsen.
  • William Bernstein Portfolio – From his book The Intelligent Asset Allocator.
  • Larry Swedroe Portfolio – Specifically, his “Eliminate Fat Tails” portfolio.

Faber collected and calculated the average annualized returns, volatility, Sharpe ratio, and Max Drawdown percentage (peak-to-trough drop in value) of all these model asset allocations from 1973-2013. So what were his conclusions? Here some excerpts from the book:

If you exclude the Permanent Portfolio, all of the allocations are within one percentage point.

What if someone was able to predict the best-performing strategy in 1973 and then decided to implement it via the average mutual fund? We also looked at the effect if someone decided to use a financial advisor who then invested client assets in the average mutual fund. Predicting the best asset allocation, but implementing it via the average mutual fund would push returns down to roughly even with the Permanent Portfolio. If you added advisory fees on top of that, it had the effect of transforming the BEST performing asset allocation into lower than the WORST.

Think about that for a second. Fees are far more important than your asset allocation decision! Now what do you spend most of your time thinking about? Probably the asset allocation decision and not fees! This is the main point we are trying to drive home in this book – if you are going to allocate to a buy and hold portfolio you want to be paying as little as possible in total fees and costs.

So after collecting the best strategies from the smartest gurus out there, all with very different allocations, the difference in past performance between the 12+ portfolios was less than 1% a year (besides the permanent portfolio, which had performance roughly another 1% lower but also the smallest max drawdown). Now, there were some differences in Sharpe ratio, volatility, and max drawdown which was addressed a little but wasn’t explored in much detail. There was no “winner” that was crowned, but for the curious the Arnott portfolio had the highest Sharpe ratio by a little bit and the Permanent portfolio had the smallest max drawdown by a little bit.

Instead of trying to predict future performance, it would appear much more reliable to focus on fees and taxes. I would also add that all of these portfolio backtests looked pretty good, but they were all theoretical returns based on strict application of the model asset allocation. If you are going to use a buy-and-hold portfolio and get these sort of returns, you have to keep buying and keep holding through both the good times and bad.

Although I don’t believe it is explicitly mentioned in this book, Faber’s company has a new ETF that just happens to help you do these things. The Cambria Global Asset Allocation ETF (GAA) is an “all-in-one” ETF that includes 29 underlying funds with an approximate allocation of 40% stocks, 40% bonds, and 20% real assets. The total expense ratio is 0.29% which includes the expenses of the underlying funds with no separate management fee. The ETF holdings have a big chunk of various Vanguard index funds, but it also holds about 9% in Cambria ETFs managed by Faber.

Since it is an all-in-one fund, theoretically you can’t fiddle around with the asset allocation. That’s pretty much how automated advisors like Wealthfront and Betterment work as well. If you have more money to invest, you just hand it over and it will be invested for you, including regular rebalancing. The same idea has also been around for a while through the under-rated Vanguard Target Retirement Funds, which are also all-in-one but stick with simplicity rather than trying to capture possible higher returns though value, momentum, and real asset strategies. The Vanguard Target funds are cheaper though, at around 0.18% expense ratio.

Well, my portfolio already very low in costs. So my own takeaway is that I should… do nothing! 🙂

Alpha Architect also has a review of this book.

My Money Blog has partnered with CardRatings and may receive a commission from card issuers. Some or all of the card offers that appear on this site are from advertisers and may impact how and where card products appear on the site. MyMoneyBlog.com does not include all card companies or all available card offers. All opinions expressed are the author’s alone, and has not been provided nor approved by any of the companies mentioned.

MyMoneyBlog.com is also a member of the Amazon Associate Program, and if you click through to Amazon and make a purchase, I may earn a small commission. Thank you for your support.


$30,000 Beat-the-Benchmark Experiment – One Year Update, Part 1

My Money Blog has partnered with CardRatings and may receive a commission from card issuers. Some or all of the card offers that appear on this site are from advertisers and may impact how and where card products appear on the site. MyMoneyBlog.com does not include all card companies or all available card offers. All opinions expressed are the author’s alone.

It’s finally been a full year since starting my Beat the Market Experiment, a series of three portfolios started on November 1st, 2012:

  1. $10,000 Passive Benchmark Portfolio that would serve as both a performance benchmark and an real-world, low-cost portfolio that would be easy to replicate and maintain for DIY investors.
  2. $10,000 Beat-the-Benchmark Speculative Portfolio that would simply represent the attempts of an “average guy” who is not a financial professional and gets his news from mainstream sources to get the best overall returns possible.
  3. $10,000 P2P Consumer Lending Speculative Portfolio – Split evenly between LendingClub and Prosper, this portfolio is designed to test out the alternative investment class of person-to-person loans. The goal is again to beat the benchmark by setting a target return of 8-10% net of defaults.

I’m splitting this summary up: Part 1 will focus on the Benchmark vs. Beat-the-Benchmark results. Part 2 will include the P2P lending performance. Values given are as of November 1, 2013.

$10,000 Benchmark Portfolio. I initially put $10,000 into index funds at TD Ameritrade due to their 100 commission-free ETF program that includes free trades on the most popular low-cost, index ETFs from Vanguard and iShares. With no minimum balance requirement, no maintenance fees, and no annual fees, I haven’t paid a single fee yet on this account. The portfolio used an asset allocation model based on a David Swensen model portfolio, which I bought and held through the entire yearlong period.

The total portfolio value after one year was $12,095, up 21%. Here’s how each separate asset class fared from November 1st, 2012 to November 1st, 2013 (excluding dividends):

  • Total US Stocks +$986 (+25%)
  • Total International Stocks +$588 (+15%)
  • US Small Cap Stocks +$150 (+30%)
  • Emerging Markets Stocks -$3 (-1%)
  • US REIT +$72 (+7%)

Screenshot of holdings below:

[Read more…]

My Money Blog has partnered with CardRatings and may receive a commission from card issuers. Some or all of the card offers that appear on this site are from advertisers and may impact how and where card products appear on the site. MyMoneyBlog.com does not include all card companies or all available card offers. All opinions expressed are the author’s alone, and has not been provided nor approved by any of the companies mentioned.

MyMoneyBlog.com is also a member of the Amazon Associate Program, and if you click through to Amazon and make a purchase, I may earn a small commission. Thank you for your support.