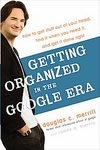
Free Download: Microsoft Money Plus Sunset Deluxe

My Money Blog has partnered with CardRatings and may receive a commission from card issuers. Some or all of the card offers that appear on this site are from advertisers and may impact how and where card products appear on the site. MyMoneyBlog.com does not include all card companies or all available card offers. All opinions expressed are the author’s alone.

Personal finance software Microsoft Money was discontinued as of mid-2009, but Microsoft recently released Money Plus Sunset Deluxe and Money Plus Sunset Home and Business available for free download.

Why?…
The stated reason for these editions is to avoid any ongoing online activation/re-activation issues with old software. Do be aware that the online abilities are disabled (no online quotes, no bill payment, no statement downloads initiated by Money, no data sync with MSN Money online services). There will not be any additional support available from Microsoft, only online self-help and through other users.

Money Plus Sunset Deluxe is designed to be a replacement for expired versions of Money Plus Essentials, Money Plus Deluxe, and Money Plus Premium versions. Money Plus Sunset Home and Business is designed to be a replacement for expired versions of Money Plus Home and Business.

Worth a download?
If you’re okay with staying offline, this version of MS Money might serve as an adequate free personal accounting and tracking software for a while longer. You can still manually import MS Money OFX files from your bank or other financial institutions. The Business versions allow to you print invoices. If you have an older version of Money, this is basically a free upgrade to the last edition sold.

Otherwise, it’s probably time to take another look at Intuit Quicken if you still want a full-featured desktop solution, which starts at about $40.

My Money Blog has partnered with CardRatings and may receive a commission from card issuers. Some or all of the card offers that appear on this site are from advertisers and may impact how and where card products appear on the site. MyMoneyBlog.com does not include all card companies or all available card offers. All opinions expressed are the author’s alone, and has not been provided nor approved by any of the companies mentioned.

MyMoneyBlog.com is also a member of the Amazon Associate Program, and if you click through to Amazon and make a purchase, I may earn a small commission. Thank you for your support.


Ask The Readers: Favorite Personal Finance Apps for iPhone & iPod Touch?

My Money Blog has partnered with CardRatings and may receive a commission from card issuers. Some or all of the card offers that appear on this site are from advertisers and may impact how and where card products appear on the site. MyMoneyBlog.com does not include all card companies or all available card offers. All opinions expressed are the author’s alone.

No, I didn’t get an iPhone. But I did get an iPod Touch over Thanksgiving weekend. (Hurray for Amazon matching Apple Store Black Friday prices!) I know, I know, as a financial blogger I’m supposed to shun such trendy toys, but it was a gift! My parents got one for my sister as well as themselves, and I am assigned to teach them how to use it when I visit in December.

(I’m excited because my HTC TouchPro2 with my $30 Sprint SERO can be hacked to share it’s 3G connection as a WiFi Router, so I can get my iTouch online anywhere I have cell coverage. Nearly an iPhone!)

Another perk is that now I can review all those personal finance apps out there. I know there are a lot of budgeting apps, the Mint.com app, and various ones for banks and brokerage companies.

What are your favorite apps? Which ones were worth the money, and which ones weren’t? Which free and non-free apps would you like me to review? Share in the comments below.

My Money Blog has partnered with CardRatings and may receive a commission from card issuers. Some or all of the card offers that appear on this site are from advertisers and may impact how and where card products appear on the site. MyMoneyBlog.com does not include all card companies or all available card offers. All opinions expressed are the author’s alone, and has not been provided nor approved by any of the companies mentioned.

MyMoneyBlog.com is also a member of the Amazon Associate Program, and if you click through to Amazon and make a purchase, I may earn a small commission. Thank you for your support.


Tracking Investment Portfolio Using Google Docs

My Money Blog has partnered with CardRatings and may receive a commission from card issuers. Some or all of the card offers that appear on this site are from advertisers and may impact how and where card products appear on the site. MyMoneyBlog.com does not include all card companies or all available card offers. All opinions expressed are the author’s alone.

I spent a little time tinkering with Google Docs Spreadsheets today, trying to use it to track the asset allocation of my investment portfolio.

GoogleFinance() Function
This function allows you to import data from Google Finance like current stock prices, p/e ratios, or performance. Here is the Google Docs Help page. For example, if you want to pull up the price of a share of Google stock, you’d enter this into a cell.

=GoogleFinance("GOOG"; "price")

Importing Personal Data
I could not find an easy way to import my actual holdings into Google Docs, but I’m not sure if you want that capability due to privacy concerns. Google Docs does allow you to import from RSS or XML feeds. I ended up just manually entering the ticker symbols and number of shares I held for each mutual fund. This means I will have to update my 401(k) funds after each paycheck, and my other holdings when I make a transaction or when a dividend is paid.

Shared Example
Below is a shortened version of my online file, as a quick example.

You can view the full version more easily here. To edit, go to File and click on “Create a copy…”. You can then poke around and change the ticker symbols to your own.

In the full version, I have columns that compare my current asset allocation percentages to my target percentages. This can help people who wish to rebalance when their allocations are off by a certain amount. I can see that I am currently overweight in Emerging Markets due to their recent run-up, and underweight in TIPS. Everything else seems close enough.

The pie charting function seems a little buggy, I couldn’t get it to show the proper labels.

My Money Blog has partnered with CardRatings and may receive a commission from card issuers. Some or all of the card offers that appear on this site are from advertisers and may impact how and where card products appear on the site. MyMoneyBlog.com does not include all card companies or all available card offers. All opinions expressed are the author’s alone, and has not been provided nor approved by any of the companies mentioned.

MyMoneyBlog.com is also a member of the Amazon Associate Program, and if you click through to Amazon and make a purchase, I may earn a small commission. Thank you for your support.


Microsoft Money Discontinued, Transfer Your Data To Quicken

My Money Blog has partnered with CardRatings and may receive a commission from card issuers. Some or all of the card offers that appear on this site are from advertisers and may impact how and where card products appear on the site. MyMoneyBlog.com does not include all card companies or all available card offers. All opinions expressed are the author’s alone.

If you use Microsoft Money to manage your finances, you should know that Microsoft will no longer be selling MS Money after June 30th, 2009. From the Microsoft product page:

With banks, brokerage firms and Web sites now providing a range of options for managing personal finances, the consumer need for Microsoft Money Plus has changed. After suspending annual updates of Money Plus in 2008, Microsoft is announcing today that we will no longer offer Microsoft Money Plus for purchase after June 30, 2009.

But more importantly, your online services will also be discontinued soon. This means stock and mutual fund quotes, tax rate updates, and banking services like their billpay.

For Money Plus Deluxe, Premium and Home & Business customers, online services expire two years after initial activation or Jan. 31, 2011, whichever is earlier; for Money Plus Essentials it is one year after activation or Jan. 31, 2011, whichever is earlier. You can verify your expiration date in Money Plus by selecting Help / About Microsoft Money; it appears to the right of the serial number.

Ditched by Money, but Quicken Wants You
I suppose that this means Intuit wins the desktop personal finance software war. Indeed, it looks like Microsoft has really given up, as their last step is to make it easy for users to move to Quicken.

We’re working closely with Microsoft to develop an easy way for Money users to transfer data into Quicken desktop products. We’re assessing how we can make this capability a reality in conjunction with the release of Quicken 2010 in the fall.

An Intuit representative e-mailed me saying that they are working quickly on making a conversion file that would seamlessly move data from Money to Quicken.

In the meantime, Quicken is directly targeting the Money orphans by offering up to a $50 discount on Quicken products until the end of June: $20 off Quicken Deluxe, $30 off Quicken Premier and Home & Business, and $50 off Quicken Rental Property Manager.

Free Quicken Online & Others
But wait, MS Money says the primary reason they shut down is that many banks and brokerages are offering free aggregation services which provide a similar service. Indeed, there are also standalone aggregation sites like Yodlee, Mint, and Geezeo. And if you want a free desktop finance software with double-entry accounting, there is the open-source GnuCash, though it certainly lacks some polish.

But wait, why didn’t they just do their own online version? Intuit introduced Quicken Online, which is now free and tries to add a little Quicken flavor to the usual aggregation model. More competition would have been good. I guess they spent all their energy on Bing.

My Money Blog has partnered with CardRatings and may receive a commission from card issuers. Some or all of the card offers that appear on this site are from advertisers and may impact how and where card products appear on the site. MyMoneyBlog.com does not include all card companies or all available card offers. All opinions expressed are the author’s alone, and has not been provided nor approved by any of the companies mentioned.

MyMoneyBlog.com is also a member of the Amazon Associate Program, and if you click through to Amazon and make a purchase, I may earn a small commission. Thank you for your support.


Access Morningstar X-Ray, Portfolio Management Tools For Free

My Money Blog has partnered with CardRatings and may receive a commission from card issuers. Some or all of the card offers that appear on this site are from advertisers and may impact how and where card products appear on the site. MyMoneyBlog.com does not include all card companies or all available card offers. All opinions expressed are the author’s alone.

Morningstar.com has a bunch of helpful tools for managing your investment portfolio. Many of them are free, but some require you to be a member. Premium membership is not cheap at $174 a year ($115 with Fidelity account), although you do get other features like mutual fund analyst reports. But since I’m not interested in those, I was happy to discover that most of the free tools and even some of the normally paid tools are available to all at T. Rowe Price. You don’t even need an account with them. Both sites require free registration (basically just e-mail).

Here is a roundup of the tools that are available, along with links to both sites where available. Since many of the tools are integrated, I have found it easier just to keep all my data at T. Rowe Price.

Portfolio Manager (TRP / Morningstar)
Portfolio Manager “enables you to track, rebalance, and analyze your portfolio. It includes a complete picture of all your holdings’ prices and performance – individual securities and funds together – in a convenient one-page format that’s updated throughout the trading day.” You can either track all your transactions as you go, or just input your current holdings. The Morningstar version differs by appearing to be slightly newer, and allows you to import your portfolio from an external Quicken/Money/Broker .csv file.

Portfolio X-Ray and Portfolio Instant X-Ray (TRP / Morningstar)
The Morningstar Portfolio X-Ray tool is a great tool that lets your look “under the hood” of your mutual funds. Does your “small cap” fund really own a bunch of mid-caps and large-cap funds? X-Ray will reveal your true exposure to stock style (i.e. Small/Mid/Large, Growth/Blend/Value), geographical regions (i.e. Japan, US) , stock sectors (i.e. Telecom, Energy), and individual equities (i.e. type, Top 10 holdings).

Also, by looking at your portfolio as a whole, you can see your true asset allocation. Maybe some of your funds have overlap that you didn’t know about. The “Instant” version, which the only version available for free at Morningstar, does not allow you to save your portfolio X-rays for future sessions.

Asset Allocator (TRP / Morningstar Premium Only)
Asset Allocator “is a quick, simple calculator that shows the probability of achieving an investment goal based on current portfolio value, investment mix, and savings rate.” Fun to play with for a while, but if you aren’t savvy it can create the illusion that the answer to reaching your goals is simply to increase your stock percentage until you get the return you want. Use with caution.

Portfolio Watchlist (TRP / Morningstar)
Portfolio Watchlist “helps you track your investments against pricing and volume targets in a convenient one-page format that’s updated throughout the trading day.” Basically the same as Portfolio Manager above, but you can track a bunch of different model portfolios. This is great for creating a benchmark for your performance, or seeing what would happen if you tweaked something.

IRA Calculator (TRP / Morningstar)
A somewhat basic tool, but still handy. The IRA Calculator has three different sections: Eligibility (determine your contribution limit for a Roth or Traditional IRA), Comparison (compare various scenarios to find out which type of IRA works best for you), and Conversion (find out whether it makes sense to convert a Traditional IRA to a Roth IRA).

My Money Blog has partnered with CardRatings and may receive a commission from card issuers. Some or all of the card offers that appear on this site are from advertisers and may impact how and where card products appear on the site. MyMoneyBlog.com does not include all card companies or all available card offers. All opinions expressed are the author’s alone, and has not been provided nor approved by any of the companies mentioned.

MyMoneyBlog.com is also a member of the Amazon Associate Program, and if you click through to Amazon and make a purchase, I may earn a small commission. Thank you for your support.


INGCompareMe: How Do YOU Compare With Others Financially?

My Money Blog has partnered with CardRatings and may receive a commission from card issuers. Some or all of the card offers that appear on this site are from advertisers and may impact how and where card products appear on the site. MyMoneyBlog.com does not include all card companies or all available card offers. All opinions expressed are the author’s alone.

Here’s another comparison site to waste some Friday afternoon time on – INGCompareMe.com. From their press release – “INGCompareMe makes it possible for anyone to see where they stand in relation to others on a wide range of saving, spending, investing, debt and personal finance matters.”

The comparison database was initially fed by a survey conducted by ING of over 5,000 adults who participated in workplace retirement savings plans. But as more people use the site (like you), their answers are also incorporated into the results.

I’m sure the ultimate goal is to sell you some sort of ING financial advice, but since the tool is anonymous I took it for a whirl. Of course, the question below provides the most insight:

Only 10% of people are below average? I guess I also live in Lake Wobegon. 🙂

My Money Blog has partnered with CardRatings and may receive a commission from card issuers. Some or all of the card offers that appear on this site are from advertisers and may impact how and where card products appear on the site. MyMoneyBlog.com does not include all card companies or all available card offers. All opinions expressed are the author’s alone, and has not been provided nor approved by any of the companies mentioned.

MyMoneyBlog.com is also a member of the Amazon Associate Program, and if you click through to Amazon and make a purchase, I may earn a small commission. Thank you for your support.


Worry-Free Investing: Calculate Your Risk-Free Savings Rate For Retirement

My Money Blog has partnered with CardRatings and may receive a commission from card issuers. Some or all of the card offers that appear on this site are from advertisers and may impact how and where card products appear on the site. MyMoneyBlog.com does not include all card companies or all available card offers. All opinions expressed are the author’s alone.

Conventional advice has been that we should invest in some mix of stocks and bonds to reach our retirement goals. But as we’ve seen, rolling the dice on a varying return distribution every year can be quite stressful. What if we start our retirement planning based on buying a safe investment that guarantees a steady after-inflation return instead? This question is posed in the book Worry-Free Investing by Bodie and Clowes.

Treasury Inflation-Protected Securities (TIPS) are bonds that promise you a total return that adjusts with the CPI index for inflation. Very generally, it works like this: if the stated real yield is 2% and inflation ends up at 4%, your return would be 6%. TIPS are issued and backed by full faith of the U.S. government, so they are as safe as they get. As your investment the automatically adjust with inflation, you will never have to deal with the stomach-churning swings of stocks, and also you avoid the risk of underperforming inflation that traditional (nominal) bonds have.

How much would you have to save if you decided to take zero market risk and invest solely in TIPS? The book outlines the mathematical formulas to use, but also provides a free spreadsheet calculator to do the heavy lifting for us. I uploaded it to ZohoSheets:

I would recommend playing with the numbers a bit. To start, the book was written in 2003 when the real rates were relatively high at around 3%. Given the recent history of the 20-year TIPS yield (shown below), I would assume a maximum of a 2.5% real interest rate.

I would also change the replacement rate to something that more closely tracks your specific expected expenses. The book recommends the income required to maintain your “minimum acceptable living standard”. For the skeptical and/or early retirees, don’t put in anything for Social Security. Finally, don’t forget to input your current savings.

You now have your personal risk-free savings rate to reach your goals. (Warning: It might be really high! If so, try retiring at 65 and input something for Social Security.) But let’s say you need to save 10%, but you are able to save 15%. You could put the 10% in the ultra-safe TIPS, and put the other 5% in something riskier to boost your returns while still guaranteeing a minimum future income. I’ll share a possible solution from the book once I get access to a flatbed scanner.

Now, there are lots of potential glitches with this simulation. For one, there is reinvestment risk because the TIPS real interest rate will continue to vary, and could drop to much lower levels. The government could even conceivably stop selling new TIPS at any time. Some people are skeptical that the CPI properly tracks inflation. Finally, TIPS are taxed at ordinary income levels, so one should keep them in tax-advantaged accounts. However, most people’s 401ks don’t include TIPS as an option! Otherwise, taxes are going to hurt returns.

In the end, I think a portfolio of 100% TIPS is impractical for most people. However, I definitely like TIPS as a component, and see this thought process as a way to estimate a “target” savings rate that can let those so-inclined to take less risk and sleep better at night.

My Money Blog has partnered with CardRatings and may receive a commission from card issuers. Some or all of the card offers that appear on this site are from advertisers and may impact how and where card products appear on the site. MyMoneyBlog.com does not include all card companies or all available card offers. All opinions expressed are the author’s alone, and has not been provided nor approved by any of the companies mentioned.

MyMoneyBlog.com is also a member of the Amazon Associate Program, and if you click through to Amazon and make a purchase, I may earn a small commission. Thank you for your support.


Archives: Useful Homebrew Financial Calculators

My Money Blog has partnered with CardRatings and may receive a commission from card issuers. Some or all of the card offers that appear on this site are from advertisers and may impact how and where card products appear on the site. MyMoneyBlog.com does not include all card companies or all available card offers. All opinions expressed are the author’s alone.

calc.jpgIf have to repeatedly have to make a calculation and I can’t find it elsewhere to my liking, I usually try and make my own calculator to save time in the future. Below are links to ones that I still use regularly, I wanted to point them out because they tend to get lost in my archives. Hopefully, they can be useful to you as well.

Ultimate Interest Rate Chaser Calculator
A “rate chaser” is someone who move their money to whichever bank offers the highest interest rates. For example, due to various promotions I have over 10 accounts open at various online banks. This calculator helps you figure out how much money you’ll earn by switching.

True Cost of Impulse Buying Calculator
Being smart with money is all about choices and priorities. Would you rather have another $300 iPod, or realize that with compound interest you could have an $2,000 more (inflation-adjusted!) later on. You’re not just saving $300, you’re shaving weeks off your retirement date!

Your Portfolio’s Rate of Return – Estimation Calculator
When trying to figure out your portfolio’s performance, don’t just trust the performance stats of your mutual fund or that number on your statement. Calculate it independently using this simple calculator. It gives surprisingly good estimates.

Your Portfolio’s Rate of Return – Exact Calculator
Slightly more complicated to use, but more accurate. You must know the dates and corresponding amounts of cash inflows and outflows.

Asset Allocation Guide: Percentage Of Your Portfolio In Stocks?
The calculator at the bottom shows you how your stocks/bonds ratio might look if you use popular Target Date mutual funds as a reference.

0% Balance Transfer Profit Calculator Tool
My series of articles on How To Make “Free” Money From 0% APR Balance Transfers has been very popular and many readers have also jumped in. Despite the risks, I’m still happily earning some money from the credit card companies for a change, and haven’t missed any payments.

This calculator is for the analytical types that want to have a better idea of profit potentials. The calculator takes into account minimum payments required by credit card issuers. Use in conjunction with my list of best 0% APR balance transfer offers.

My Money Blog has partnered with CardRatings and may receive a commission from card issuers. Some or all of the card offers that appear on this site are from advertisers and may impact how and where card products appear on the site. MyMoneyBlog.com does not include all card companies or all available card offers. All opinions expressed are the author’s alone, and has not been provided nor approved by any of the companies mentioned.

MyMoneyBlog.com is also a member of the Amazon Associate Program, and if you click through to Amazon and make a purchase, I may earn a small commission. Thank you for your support.


Make Money From Credit Cards: 0% Balance Transfer Profit Calculator Tool

My Money Blog has partnered with CardRatings and may receive a commission from card issuers. Some or all of the card offers that appear on this site are from advertisers and may impact how and where card products appear on the site. MyMoneyBlog.com does not include all card companies or all available card offers. All opinions expressed are the author’s alone.

My series of articles on How To Make “Free” Money From 0% APR Balance Transfers has been very popular and many readers have also jumped in. Despite the risks, I’m still happily earning some money from the credit card companies for a change, and haven’t missed any payments. From the beginning, people have asked me to make a spreadsheet or calculator in order to estimate the potential profit from such endeavors. I initially decided against doing so because there are lots of different variables at stake that make an exact prediction close to impossible. However, I think it may still be useful to obtain some more realistic numbers.

Without further ado, I present to you the…

0% Balance Transfer Profit Calculator

Enter savings account APY: %
Enter starting balance: $
Enter the monthly minimum payment percentage (2%) %
Your interest earned:   $
(See assumptions and definitions below)

Inputs and Definitions

  1. Arbitraged Interest Rate (APY) – Where are you putting the money you’re borrowing for free? This is the interest rate of the investment vehicle (savings account, CD, Treasury bond) you are using, or perhaps the interest rate of the existing loan (car, home equity, student) that you are paying down.
  2. Starting Balance (dollars) – How much money are you transferring?
  3. Monthly Minimum Payment (%) – Usually you must still make a monthly minimum payment on the outstanding balance during the 0% period, which will decrease your profit potential slightly. This is usually around 2%, but may vary between 1.5% and 4%.

Assumptions

  1. The balance transfer is for 12 months at 0% APR, with no balance transfer fee. You can find my list of the best 0% APR offers here with low or no balance transfer fees here.
  2. The interest is assumed to compound monthly, which allows me to convert from APY to APR, and then to a periodic rate. Compounding frequency is a variable here, but doesn’t change the numbers too much.
  3. I am ignoring the time required to actually convert the balance transfer into cash earning interest. Sometimes this can take up to a few weeks, sometimes it is much faster. Instead of guessing, I just leave it be.
  4. I am also ignoring things like grace periods and the timing of statement cycles and due dates, which can actually increase the time that your borrowed money is earning interest, and thus your profit.
  5. If you are earning interest in a taxable bank account, you will likely owe income tax on that interest at your marginal rate. This is not accounted for in the calculator, but is a simple calculation.

(If you’re confused about what I am talking about, please refer to the tutorial mentioned above.)

Example Profit Calculation
Let’s say you obtain $15,000 and place it in a bank account paying 5.25% APY, with a 2% monthly payment. Using our assumptions, the 5.25% APY is equivalent to 5.13% APR, or earning 0.4273% of the balance each month.

Beginning of Month #1: You have $15,000 in the bank. Total balance left on credit card: $15,000. Nothing is due yet.
End of Month #1: You earn $64.10 in interest, but also need to pay back $300 (2% of $15,000) out of your bank balance for the minimum payment.

Beginning of Month #2: Total in bank:$14,764.10. Total balance left on credit card: $14,700.
End of Month #2: You earn $63.09 in interest, but also need to pay back $294 (2% of 14,700).

This continues for 12 months, as shown below:

altext

At the end of the 12th month, your bank balance is $12,477.87, and you still owe $11,770.75 on the card. You pay it off completely, leaving you with the resulting estimated profit of $707.12.

Play around with the calculator. Some people actually have over $100,000 out at once, earning them thousands of dollars a year. My credit limits aren’t quite that high…. yet!

My Money Blog has partnered with CardRatings and may receive a commission from card issuers. Some or all of the card offers that appear on this site are from advertisers and may impact how and where card products appear on the site. MyMoneyBlog.com does not include all card companies or all available card offers. All opinions expressed are the author’s alone, and has not been provided nor approved by any of the companies mentioned.

MyMoneyBlog.com is also a member of the Amazon Associate Program, and if you click through to Amazon and make a purchase, I may earn a small commission. Thank you for your support.


Cost Comparison Tool For Comparing Vanguard ETFs and Mutual Funds

My Money Blog has partnered with CardRatings and may receive a commission from card issuers. Some or all of the card offers that appear on this site are from advertisers and may impact how and where card products appear on the site. MyMoneyBlog.com does not include all card companies or all available card offers. All opinions expressed are the author’s alone.

While on Vanguard’s website I recently ran across a new and useful tool that help helps you calculate and compare costs for similar Vanguard ETFs and mutual funds. The tool takes into account trade commissions, the difference in expense ratio, redemptions fees, future purchases, and even the expected bid-ask spread.

For the unfamiliar, I’ll be very simplistic and say that exchange-traded funds, or ETFs, are mutual funds that can be traded like individual company stocks. Due to the way they are constructed, ETFs tend to have lower expense ratios than their mutual fund counterparts, but you will need to pay a commissions each time you trade. There is also a little bit of added loss due to the bid-ask spread.

For example, you could compare the Vanguard Total Stock Market Index Fund (VTSMX) with the Vanguard Total Market ETF (VTI). Both invest in the exact same set of companies, and holds over 1,000 companies that track closely the entire U.S. market. VTSMX charges an annual expense ratio of 0.19%, or $19 on a $10,000 investment. VTI has an expense ratio of only 0.07%, a mere $7 for each $10,000 invested.

I tried an example where I start with $10,000 of either VTSMX or VTI, and say that I will add another $1,200 each quarter for another 10 years. I assumed $5 trade commission and a 8% annual return. Here are the results:

Cost Results

(fixed the numbers :P) The cost edge goes to the ETF in this case, with a cost difference of $300. Really, I don’t see that as all that much over 10 years. But, as you get into larger amounts, the gap widens. If you continued the same example for another 20 years, the ETF’s cost advantage would be $7,000.

For this reason, I feel like it is only a matter of time before I start moving all of my current all-mutual fund portfolio into ETFs. In fact, the majority of my funds already have an identical ETF counterpart.

Anyhow, you can play with this calculator and change the variables to see your situation. Note that Admiral shares are an option once you reach $100,000 per fund. I’ve got a while before that…

But in terms of the big picture, both of these funds have very low costs and would serve as a great cornerstone to a retirement portfolio. If you are just starting out, I think you’ll see the difference is very small; I really wouldn’t stress too much about going either way.

My Money Blog has partnered with CardRatings and may receive a commission from card issuers. Some or all of the card offers that appear on this site are from advertisers and may impact how and where card products appear on the site. MyMoneyBlog.com does not include all card companies or all available card offers. All opinions expressed are the author’s alone, and has not been provided nor approved by any of the companies mentioned.

MyMoneyBlog.com is also a member of the Amazon Associate Program, and if you click through to Amazon and make a purchase, I may earn a small commission. Thank you for your support.


Tax Equivalent Yield Calculator For Savings Bonds, Treasury Bills, and Tax-Exempt Money Market Funds

My Money Blog has partnered with CardRatings and may receive a commission from card issuers. Some or all of the card offers that appear on this site are from advertisers and may impact how and where card products appear on the site. MyMoneyBlog.com does not include all card companies or all available card offers. All opinions expressed are the author’s alone.

There are many investments out there that are exempt from certain taxes. For example, U.S. Savings Bonds and Treasury Bonds are exempt from state and local income taxes. In addition, there are money market funds available that are exempt from federal income tax and others that are even exempt from a specific state or city’s income taxes.

Therefore, it is desirable to know what the equivalent fully-taxable rate is for one of these investments. For example, is it more profitable to earn a federal tax-exempt interest rate of 3.8% or a fully taxable 5.0%? How about a Treasury Bill paying 4.8%? Several variables affect this rate, including your marginal tax brackets for each area, as well as if you itemize your state and local taxes on your federal tax return. I could not find a calculator that accurately captured all of this, so I made my own.

Tax Equivalent Yield Calculator
(You may need to be on the individual post page for it to work.)

Enter the interest rate: %
Enter your marginal federal income tax rate: %
Enter your marginal state income tax rate (if any): %
Enter your marginal city/local income tax rate (if any): %
Exempt?
Federal Tax-Exempt
State Tax-Exempt
City/Local Tax-Exempt
Itemize?
Do you itemize deductions? Yes
No
Your tax-equivalent rate:   %

Example
Let’s say you live in California, and your marginal federal tax rate is 25%, your state rate is 9.3%, and you have no local income taxes. You do not itemize your taxes. You are trying to compare the taxable Vanguard Prime Money Market Fund (VMMXX, yielding 5.08%), the federally exempt Vanguard Tax-Exempt Money Market Fund (VMSXX, yielding 3.48%), and the state and federal tax-exempt Vanguard California Tax-Exempt Money Market Fund (VCTXX, yielding 3.38%).

With that profile, the tax equivalent 7-day yields would be 4.804% for VMSXX, and 5.145% for VCTXX, making the California Tax-Exempt Fund the best bet currently for this specific situation.

How It Works (Warning: Math Ahead!)
The calculator computes the tax-equivalent rates by comparing after-tax returns. That is:

AfterTaxReturnEquivalentTaxableRate = AfterTaxReturnTaxAdvantagedRate

Using the California Tax-Exempt Fund example above:

EquivalentRate x (1 – FederalTaxes – StateTaxes) = 3.38%
EquivalentRate x (1 – 0.25 – 0.093) = 0.0338
EquivalentRate = 5.145%

So earning 3.38% free from federal and state taxes is the same as earning 5.145% in a fully taxable account.

Note that itemizing deductions means that you deduct your state income taxes from your federal taxable income. The effect is that your overall tax liability is reduced, which lowers the benefit of any tax-exemptions and thus the equivalent rates. That would change the previous equation to:

EquivalentRate x (1 – FederalTaxes – StateTaxes + (FederalTaxes x StateTaxes)) = 3.38%
EquivalentRate = 4.969%

The inclusion of this option may give different results from some of the other online calculators out there, but I believe it makes the results more complete. Another fully-worked-out example can be found here for savings bonds.

Finally, it may be handy to use this in conjunction with my Ultimate Interest Rate Chaser Calculator. Be sure to compare APRs to APRs and APYs to APYs.

Useful Resources
2007 Federal Tax Rates
State Income Tax Rates
Recent Treasury Bill Auction Results
Savings Bonds Rates

My Money Blog has partnered with CardRatings and may receive a commission from card issuers. Some or all of the card offers that appear on this site are from advertisers and may impact how and where card products appear on the site. MyMoneyBlog.com does not include all card companies or all available card offers. All opinions expressed are the author’s alone, and has not been provided nor approved by any of the companies mentioned.

MyMoneyBlog.com is also a member of the Amazon Associate Program, and if you click through to Amazon and make a purchase, I may earn a small commission. Thank you for your support.


What Percentage Of Your Portfolio Should Be In Stocks?

My Money Blog has partnered with CardRatings and may receive a commission from card issuers. Some or all of the card offers that appear on this site are from advertisers and may impact how and where card products appear on the site. MyMoneyBlog.com does not include all card companies or all available card offers. All opinions expressed are the author’s alone.

One of the basic ways to adjust the risk and return characteristics of your investment portfolio is to decide what percentage to hold in stocks and bonds. This is another one of those hard questions for which there is no single best answer for everyone. You must take into account risk acceptance and time horizon amongst other factors.

An old rule of thumb is that your stock allocation percentage should be 100 minus your age. That is, a 30-year old should have 70% stocks/30% bonds, and a 70-year old should have 30% stocks/70% bonds. This was not just taken out of thin air, and has a basis from historical returns. As you near retirement, you want to have more bonds as that reduces overall volatility. More recently, others have altered this to a more aggressive “110-age” or even “120-age”.

Members of the Diehards investment forum recently performed a informal survey of member’s asset allocations versus their age, and here are the results:

Credit: Diehards Form

As you can see, there is definitely a lot of scatter in the data. However, if you made a linear fit, it roughly corresponds to a formula of stock percentage = 112.5 – age.

This made me curious – what about all those Target Retirement Funds? Their job is to decide an asset allocation that works for as many people as possible based on their retirement date. If I assume that people retire at 65 years old, here is what the asset allocation versus age looks like for three of the more popular fund families: Vanguard, Fidelity, and T. Rowe Price:

Target Retirement Fund Asset Allocation vs. Age

As you can see, the funds are actually pretty aggressive. (I covered previously how T. Rowe Price is more aggressive than Vanguard.) If one did force linear fits for all three fund families, it would correspond roughly to stock percentage of 119 – age. However, they don’t really adjust linearly with time. If I use a 2nd order curve fit instead, I can make a little tool that estimates their stock percentages for any age:

Input Your Age: Years
Percentage in Stocks
Vanguard Model:   %
Fidelity Model:   %
T. Rowe Price Model:   %
120 – Age:   %
113 – Age:   %

None of this is investment advice, it’s just an observation of what’s out there. Next, I’ll try to find some historical return and standard deviation numbers for another view of how to answer this question. What do you think of all this?

My Money Blog has partnered with CardRatings and may receive a commission from card issuers. Some or all of the card offers that appear on this site are from advertisers and may impact how and where card products appear on the site. MyMoneyBlog.com does not include all card companies or all available card offers. All opinions expressed are the author’s alone, and has not been provided nor approved by any of the companies mentioned.

MyMoneyBlog.com is also a member of the Amazon Associate Program, and if you click through to Amazon and make a purchase, I may earn a small commission. Thank you for your support.