 Here are some charts from a Credit Suisse research report that you should keep in mind when reading articles about high valuations and future returns. I first saw the highlighting done by WSJ Daily Shot, but I can’t find the post anymore.
Here is a chart plotting the starting Forward P/E ratio and the subsequent 10-year annualized returns for US Stocks (S&P 500). As of September 2018, the Forward P/E ratio is approximately 17. As you can see, this is higher than the historical average, with the trendline suggesting that the average expected future return is about 5% annually. Chart like this explain why many articles warn of low returns ahead.
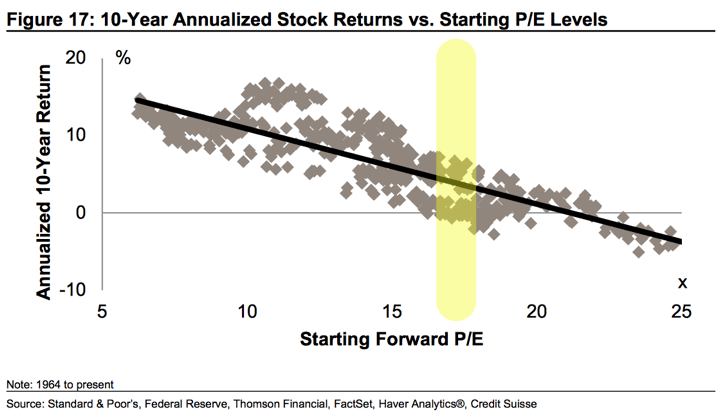
However, step back and you see that the historical range has varied from -1% to 8%. Over 10 years, that’s a big spread. It’s the difference between $100,000 turning into $90,000 or $215,000. Focusing on the line gives you a false sense of accuracy.
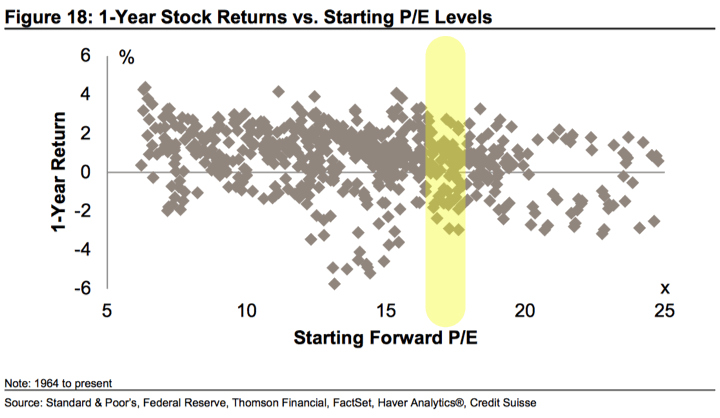
Here is a chart plotting the starting Forward P/E ratio and the subsequent ONE-year annual return for US Stocks (S&P 500). In the next year, just about anything could happen! You should shoot up 30%+ or drop 30%+. (There appears to be a typo with the vertical axis missing some zeros. I believe the range should be from -60% to +60%.)
P/E ratios are not reliable for market timing. Yes, P/E ratios are something to watch and consider, especially to keep reasonable expectations for long-term returns. But when people sell all their stocks, they feel a drop is coming soon, not 10 years out. That crash might happen. But it might not. As the John Maynard Keynes quote goes, “The market can stay irrational longer than you can stay solvent.”
In my opinion, it is a much more reliable bet to maintain broad exposure to stocks for decades. You can do some trimming around the edges if that helps you minimize regret.
 The Best Credit Card Bonus Offers – March 2024
 Big List of Free Stocks from Brokerage Apps
 Best Interest Rates on Cash - March 2024
 Free Credit Scores x 3 + Free Credit Monitoring
 Best No Fee 0% APR Balance Transfer Offers
 Little-Known Cellular Data Plans That Can Save Big Money
 How To Haggle Your Cable or Direct TV Bill
 Big List of Free Consumer Data Reports (Credit, Rent, Work)
I don’t think it’s fair to say they don’t predict anything. Are they accurate enough to try and time the market–or sell all of your stock, certainly not. But I think you can certainly make the case they can be useful to limit your exposure somewhat–allocate a larger percent of your exposure to bonds or buy some insurance via options, etc.
As Warren Buffet said–“Be Fearful when others are greedy [high P/E] and greedy when others are fearful [low P/E]”.
Forward P/E is a poor choice because it’s a guesstimate of future earnings. Correlation with future returns gets much tighter when something like the Shiller P/E is used which uses the previous 10-year period inflation adjusted earnings in the denominator. Even then, using this to forecast future returns is only useful for longer term periods in the future (10 years or so).