Here another data point on the topic of adding international bonds to your portfolio. The AllianceBernstein Blog has post on how adjusting the US/Global mix of your bond asset allocation affects risk-adjusted returns:
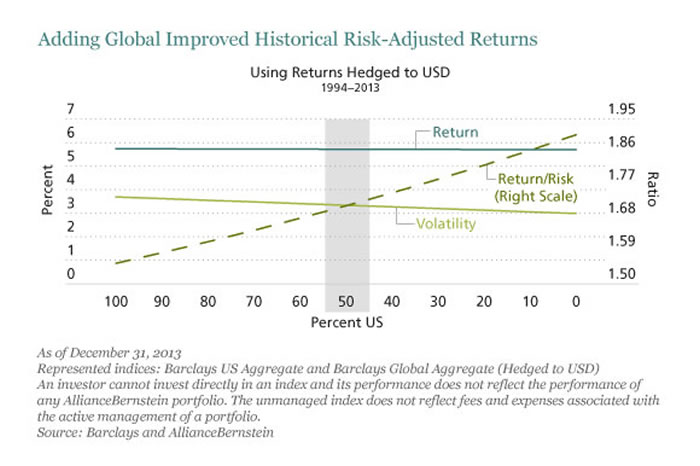
Using data from 1994-2013, you can see some trends as you go from 100% US bonds to 50/50 to 100% International ex-US (hedged). As you add more international the historical return drops a little bit, but the volatility drops even more. Thus, the risk-adjusted return actually goes up (dotted-line). The author suggests a 50/50 US/non-US mix as a “realistic target”, while reminding you that if you do add international bond exposure it should be currency-hedged.
Also note the fine print that the chart measures the performance of an index, while international bond funds usually have higher fees in the real world. For example, the Vanguard Total International Bond ETF (BNDX) has an expense ratio of 0.20%, while the domestic Vanguard Total Bond Market ETF (BND) has an expense ratio of 0.08%. The gap is smaller that it used to be, but it still exists.
So it is a critical asset class to include? International bonds are the world’s largest asset class by market cap. Since 2013, Vanguard has included international bonds in their Target Date Retirement and LifeStrategy all-in-one mutual funds – currently 20% of the total bond allocation.
I’m still not convinced myself. I think there may be a benefit in a real-world portfolio, but it likely will be small and even smaller after the higher fund fees and internal trading costs. I just don’t feel the need for such added complexity. As the cost gap shrinks further, I will reconsider.
 The Best Credit Card Bonus Offers – March 2024
 Big List of Free Stocks from Brokerage Apps
 Best Interest Rates on Cash - March 2024
 Free Credit Scores x 3 + Free Credit Monitoring
 Best No Fee 0% APR Balance Transfer Offers
 Little-Known Cellular Data Plans That Can Save Big Money
 How To Haggle Your Cable or Direct TV Bill
 Big List of Free Consumer Data Reports (Credit, Rent, Work)
Speak Your Mind