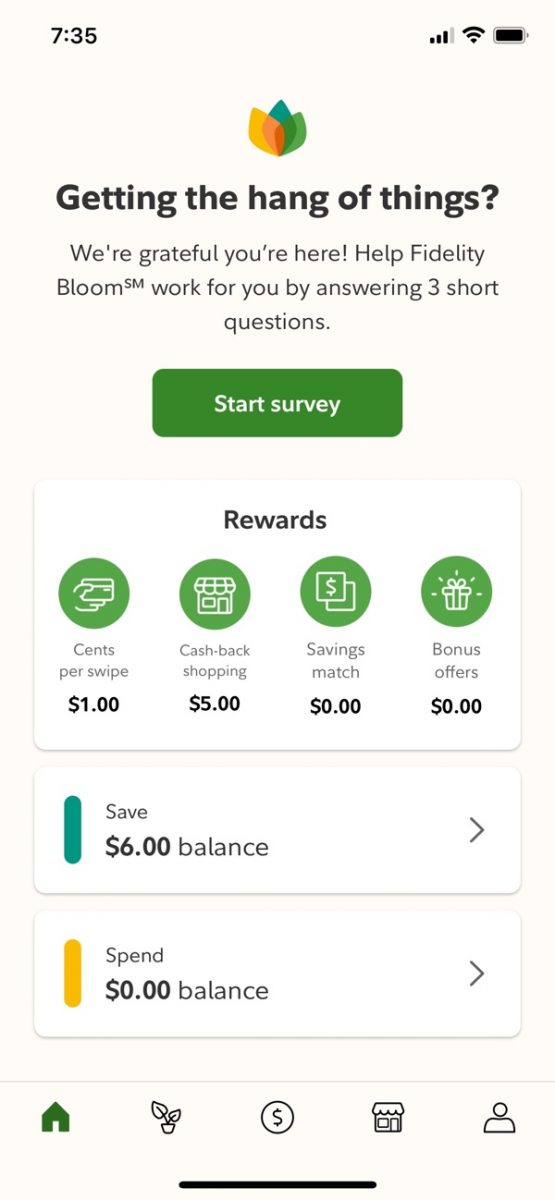
Archive for the 'Investing' Category
Friday, August 26th, 2011
Has the stock market turbulence from the last few weeks got you pooping in your diaper? You’re not alone. Here’s a parody video of the usually confident E-Trade baby facing some portfolio losses. Warning: Some bleeped-out curse words.
CollegeHumor via Allan Roth.
Posted in Funny, Investing | No Comments »
Thursday, August 25th, 2011
Whether you invest your hard-earned money in passive index funds or actively-managed funds, the more important thing is that costs matter. Every penny you pay in mutual fund expense ratios, sales loads, trade commissions, and financial advisor fees reduces your return. Even Morningstar, a company famous for their proprietary
star rating system, looked at their data and admitted that expense ratios are the “most dependable predictor of performance” and should be the “primary test in fund selection”. I like to visualize high expenses as a constant, relentless drag that is almost impossible to overcome over long periods of time. You can play with this cost widget to see how much costs eat into returns over time.
Here comes more proof. I invest a huge chunk of my money in Vanguard funds, because they offer the best selection of low-cost mutual funds around. Every year, as they get more successful, my costs actually go down as they advantage of economies of scale. However, they also offer a large selection of actively-managed funds, one of which has been around since 1928.
Data from Lipper Ratings shows that over 80% of Vanguard funds (both active and passive) have outperformed peer funds in the same categories over the last 5- and 10-year period ending 6/30/11.
You’ll find that T. Rowe Price also touts the returns of their group of funds:
Not by accident, one of their tenets of investing is low costs:
Low-Cost, Active Management
We believe in actively managing our funds and pursue a disciplined process to individually evaluate every stock and bond we invest in. But we don’t believe it should cost a lot. We keep our expenses low, so your investment can go even further. We offer over 90 funds with no loads, no sales charges, and expense ratios below their Lipper category averages.
Survivorship Bias
Making the case even stronger, by hovering over the the Vanguard chart, you can see how many peer funds there were. Let’s just take the stock funds. For the 1-year comparison, there were 10,644 funds in their peer category. For the last-3 years, that drops to 9,207 peer funds. Last 5 years, 7,562 peer funds. Over the last 10-years, only 4,035 peer funds existed.
Where did all the funds go? Sure, some funds are new, but there were lots of new funds back in 2000 as well. The fact is that many older funds are unable to be compared today because they never lasted 10 years. Most likely, their performance was so low that they quietly closed down or merged with another fund. This is called survivorship bias, and means that existing funds did even better than these charts might indicate because of the dead funds that aren’t even included.
Posted in Investing | 4 Comments »
Tuesday, August 23rd, 2011
Last week, I shared a chart that showed how a diversified portfolio that was rebalanced regularly still managed to nearly double in value over the last decade. Here’s another similar finding based on the David Swensen portfolio as compiled by an advisor group called ETF Portfolio Management.
Swensen manages the Yale University endowment and wrote an excellent investment book called Unconventional Success (my review) directed towards individual investors. Even though he does active management himself, he explains why low costs and low turnover are critical, how certain asset class are better than others, and why rebalancing regularly is important. He ends up providing a model portfolio made up of what he calls “Core” asset classes. Here’s the slightly updated David Swensen Portfolio with his recommended 70% stocks / 30% bonds breakdown. Actual low-cost index ETFs are included via ticker symbols.
30% Domestic US Equity (VTI)
15% Foreign Developed Equity (VEA)
10% Emerging Markets (VWO)
15% Real Estate (VNQ)
15% U.S. Treasury Bonds (IEF)
15% Inflation-Protected Securities (TIP)
Instead of the Total Bond Index from last week, which include everything from Treasuries to corporate bonds to mortgage-backed securities, the Swensen bond allocation only has nominal and inflation-linked Treasury bonds. The chart below shows the growth of $1,000 invested this way (eMAC) at the start of 2001 until the end of July 2011. (Last week’s chart included the start of 2000 to end of 2009.) The ETFs listed above were bought and rebalanced annually. eMAC stands for “efficent multi-asset class”.
Again, we see that the diversified and rebalanced portfolio has done well over the last 10 years, more than doubling in value. Check out their annual returns breakdown (summarized below), and you can see how in any single year different asset classes will have different returns. Some go up, some stay steady, some go down. This lack of strong correlation is what helps smooth out your portfolio, and makes you feel better that at least something is doing okay at any given time.
Now, this may not be the ideal portfolio going forward. Nobody knows the future, you can only do what you think gives you the best odds for success. But it does serve as another real-world example of how low-cost diversification works and that you should have good reasons for holding each of the asset classes that you buy.
(The “HF Index” indicated stands for the Dow Jones Credit Suisse Hedge Fund Index, which claims to track ~8,000 hedge funds and thus tracks overall hedge fund performance. After poking around their website, the returns seem to be net of manager fees.)
Posted in Investing, Retirement | 10 Comments »
Wednesday, August 17th, 2011
There is a lot of uncertainty in investing, and it always seems like especially now. Buy and hold has been called dead many times. However, if you look carefully, you’ll find that there are many people who have quietly grown their portfolio over the last decade using the boring principles of diversification, low-costs, and regular rebalancing. I would also add proper tax planning helps as well.
Here is some data from a WSJ article by Burton Malkiel (author of Random Walk Down Wall Street) that helps illustrates this. (Can’t view the article? Use this Google the title trick and click the first link.) The article is from several months ago, but the S&P 500 index back then was almost exactly the same as yesterday: 1,193 vs. 1,195.
The chart below shows the growth of $100,000 invested at the start of 2000 until the end of 2009. As you can see, a 100% stock investment (in green) would have ended up at $93,717. Thus the term “lost decade for stocks”.
But what happens when you mix in some other assets, and rebalanced them annually? The red line is a portfolio consisting of 67% stocks and 33% bonds, all in low-cost index funds. The stock breakdown was 27% US, 14% Developed International, 14% Emerging Markets, and 12% REITs. The result was a ending balance of $191,859, which means an investor in 2000 could have, without special psychic powers, nearly doubled their portfolio over the same “lost decade”.
The diversified portfolio above matches rather well with my own asset allocation. For one, my AA also has 50/50 US/non-US split plus a chunk in REITs. Although I started out 85% stocks/15% bonds, I am now closer to 75% stocks. I have also rebalanced annually to maintain that ratio, but I do feel that my portfolio has still grown past my contributions even though I haven’t tracked my personal returns as well as I’d like.
Regular rebalancing is key. That is, keeping your target asset allocation by buying what is going down, and selling what is going up, in order to keep your desired risk profile. Both in early 2009 and last week, I was buying stocks. While there is debate on this, I believe that there is a reversion-to-the-mean effect that boosts your returns.
Posted in Investing, Retirement | 15 Comments »
Tuesday, August 9th, 2011
After major stock market movements, sometimes I get asked to throw out my own commentary. Now, obviously I am not a market expert and CNBC doesn’t ever ring me up for interviews to argue with another talking head. There are also plenty of articles out there about why you should not panic and sell stocks. I can only offer what’s rattling around in my own head. A head that wears glasses from Costco and a haircut from Fantastic Sams.
Stocks provide ownership in companies, and by extension ownership of a piece of all future profits. Those profits can be either given back as dividends or reinvested in the company to try and make it even bigger (and ideally even bigger dividends eventually). Look at Microsoft, it’s finally paying a dividend after many years of share price growth. Apple, on the other hand, is still growing with no dividend. When things are uncertain, then you don’t know what those future profits are. This is why prices can vary so much. Any individual company most likely hasn’t gotten 10% worse since a week ago, but all those years and years of future profits might have been affected. People want more margin of safety now, and aren’t willing to pay as much as last week.
As someone still in the accumulation phase, I realize that I have no control over these day-to-day fluctuations. Some people look at stock charts like tea leaves and see patterns. I just tell myself that 20 years from now, the chances that the S&P 500 is still at 1200 is quite low. Actually, I focus on the overall ingenuity of the world these days, but I don’t have a handy reference number for them. So when stocks drop, I quietly keep on accumulating a larger and larger portion of these companies, which again is a larger and larger portion of all future profits. Focus on the fact that you are buying more shares, and not your actual balance down to the penny. To smooth out the ride, I keep 25% of my money in still-safe nominal and inflation-linked Treasury bonds. Ironically, after the credit downgrade, the value of US Treasuries actually went up. (See my target asset allocation & most recent portfolio update.)
If I was in the withdrawal phase of retirement, and trying to live off my portfolio, then hopefully I’d have only a much smaller portion of my portfolio in stocks. My risk tolerance would definitely be much lower. I would own more income-producing investments like dividend-paying stocks and bonds, and in this case focus on the income instead of the balance.
Posted in Investing | 6 Comments »
Monday, August 8th, 2011
Pssst… did you hear? Standard & Poor (S&P) downgraded the US credit rating from the highest AAA to one notch down at AA+. Let’s remember what these guys are famous for. The ratings agencies missed Enron a decade ago – they didn’t reduce Enron from investment grade to junk until days before they shut down. Then they missed the Worldcom accounting scandal and the Global Crossing meltdown, marking them investment grade months before bankruptcy. Then they missed Bear Stearns, only cutting their rating one business day before they never opened again. Oh, and all those mortgage-backed securities rated AAA when they were stinking piles of poo.
Now, this doesn’t mean that the S&P is necessarily wrong. I just smell a ton of politics, and I hate politics. Also, how often have they sounded an alarm that actually helped small investors? As in “Watch out, you thought this was safe but it really isn’t! Look what we figured out with our in-depth analysis!” As opposed to “Yup, we read a newspaper last week.”
Posted in Investing | 21 Comments »
Thursday, August 4th, 2011
Online discount broker TradeKing has brought back their $100 sign-up bonus for new accounts, no promotional code or referral required. You must open with $2,500 and make 3 trades within 6 months. Offer expires 8/31/11.
To qualify for this offer, new accounts must be opened and funded with $2,500 or more. Account funding must occur within 30 days of account opening, and three trades must be executed within 180 days of account opening, for account to qualify. [...] The minimum funds of $2,500 must remain in the account (minus any trading losses) for a minimum of 6 months or the credit may be surrendered. Other restrictions may apply.
If you transfer an account of $2,500 value or greater over to TradeKing, they will also refund up to $150 in account transfer fees charged by your old broker.
TradeKing will credit your account transfer fees up to $150 charged by another brokerage firm when completing an account transfer for $2,500 or more. Offer applies to new non retirement accounts funding for the first time. Credit will be deposited to your account within 30 days of receipt of evidence of charge.
TradeKing offers $4.95 trades with no minimum balance requirement or inactivity fees. I’ve been using them for a while, they are a good basic broker for ETFs and dollar-cost-averaging. I am not an active trader or daytrader.
Posted in Deals & Offers, Investing | 6 Comments »
Friday, July 29th, 2011
No, this not another book on gratuities and service workers. In the investing world, TIPS stands for Treasury Inflation-Protected Securities, which are bonds issued by the US government that pay interest which is linked to inflation. Inflation is measured by the Consumer Price Index (CPI).
As a greatly simplified example, if you bought a TIPS bond with a real yield of 2% and inflation ends up at 3%, your return would be 5%. If inflation later on jumps to 8%, your return would be then 10%. Most bonds are what we call nominal bonds. They pay a certain interest rate like 5%, regardless of what inflation is. Thus, having such inflation-linkage provides protection against inflation that is higher than expected.
These are just the basics. A cynic would tell you that you don’t hear much about TIPS because they don’t make Wall Street very much money. However, I think they are a critical component of my portfolio. So how should you go about buying them? Enter the book Explore TIPS by the anonymous blogger and former guest poster The Finance Buff. For example, it will show you how to navigate the many different ways you can buy TIPS:
- Via a mutual fund or ETF like VIPSX or TIP
- Via an official auction through TreasuryDirect or a broker
- Via the secondary market, through a broker
As with many things, buying them directly gives you more control, but less convenience. The good thing is that like Treasury bonds, holding a single bond has the same credit risk as holding 100 of them. However, you’ll need to understand things like noncompetitive bids (actually a good thing), yield-to-maturity, and inflation factors.
Even though it’s only about 100 pages long, Explore TIPS definitely comes through as its tagline promises: “A Practical Guide to Investing in Treasury Inflation-Protected Securities”. It may take a while to get through… even I don’t get excited about reading about bonds. Well, maybe a little.
Now, you could probably learn most of this stuff on your own if you spent all your time browsing investment forums and the Treasury website, but this tidy reference book will save you loads of time. On Amazon it currently runs $11.96, but you can buy the PDF version for $4.95.
Posted in Book Reviews, Investing | 5 Comments »
Thursday, July 21st, 2011
I was looking through some old posts looking for writing inspiration, when I found this one that I had completely forgotten about:
S&P 500 at 750: Thoughts From A Market Timer – Published 11/21/2008
I still remember that night rather vividly. I was on a business trip in yet another bland hotel, stuck watching CNN. The S&P 500 index had closed at 752.44, a number I though I’d never see. I logged into my Vanguard account from my laptop and watched my account values dropping, but I also sensed an opportunity. Investing gurus were always saying to buy when people were most scared. This Hussman fellow made a convincing argument that the odds were in my favor. I actually had another draft of that post with the alternate title “S&P 500 at 750: Time to Back the Truck Up?” I tentatively put in a buy/sell order to move all my money into stocks.
But I didn’t execute it. Why? I was scared. And if you read the comments on that 2008 post above, lots of other people were scared too. And it did get worse for a while. I managed not to sell everything in a panic. In fact, I didn’t sell any stocks at all. I just kept with my asset allocation and rebalanced, which meant that all my new paycheck money went into stocks. Here’s the chart of the S&P 500 since I graduated college:
Not exactly a smooth ride! Today, my portfolio is bigger than ever, but I still feel the some uncomfortableness investing with the S&P 500 at 1300. Is it too high now?
Buy, hold, rebalance. This method will always have its doubters, but I believe in it more strongly as the years have passed. This means that I’ll never be able to brag on the internet how I was “100% cash right before the crash” or “Moved all my money into stocks right before the big boom”. However, I do feel it has improved my investment returns, and that’s the real goal.
Posted in Investing | 11 Comments »
Monday, July 18th, 2011
This an update for my investment portfolio, including 401(k) plans, IRAs, and taxable brokerage holdings. There have been only a few small changes since my last portfolio update. As always, this is our own personal portfolio and may not necessarily be completely applicable to anyone else.
Asset Allocation – Target vs. Actual
I separate the stock and bond portions for clarity. My target asset allocation remains the same:
Here is my actual stock allocation, where it shows that I am slightly overweight US Total and will need do some light rebalancing.
My actual bonds allocation is not really worth making a chart for… the target is 50%/50% and I have 47% short-term nominal bonds and 53% inflation-protected bonds.
Stocks vs. Bonds Ratio
Read the rest of this entry…
Posted in Investing, Retirement | 22 Comments »
Tuesday, July 12th, 2011
I’m making another step towards a more ratio-driven way to track our financial progress towards early retirement. This is just a quick recap/explanation of the new status bar.
Emergency Fund
Our goal is to always have a full year of expenses in cash equivalents as our “emergency fund”. (This is not the same as a year of income. Our expenses are much lower than our income.) This is a cushion for a variety of potential events including job loss or other unplanned costs, and allows us to take a more long-term view with our investment portfolio.
Since our emergency fund is relatively large, I try to maximize the yield. If we stuck it all in a money market fund, the yield would be barely above zero. With a bit of work, our cash earns a blended rate of over 2% annually without taking on extra risk. See here for our most recent breakdown of cash investments.
Home Equity
I don’t think everyone should buy a house. I don’t necessarily think it’s a very good investment over time. However, if you are geographically stable, I do think buying and eventually owning a house free and clear can be a solid component of an early retirement plan. My current forecast is to have our house paid off in 10-15 years. Housing is very expensive where I live, so once that mortgage payment is gone, the actual income my investments will have to produce will drop drastically.
There are many ways to define home equity, and I admit I am using a rather generous method of calculating home equity by taking 100% minus (outstanding mortgage balance / original home purchase price). I just enjoy having continuous progress without worrying about my home’s exact market value. See here for my most recent mortgage payoff calculations.
Investment Portfolio
The goal of my investment portfolio is allow withdrawals to support my expenses (minus the mortgage). Again, income and expenses are not the same thing. I expect our required expenses to be less than 25% of our current income. I like to assume a simple 4% safe withdrawal rate, which means for every $100,000 saved, I can generate $4,000 a year of inflation-adjusted income. This may be too optimistic, but again it does provide a quick estimate of progress. My target asset allocation remains pretty much the same as here.
(The actual implementation of my plan will probably require more flexibility. I plan on using some of my money and invest in an Immediate Annuity, as well as vary my exact withdrawal rates a bit with market conditions. Once I reach 67 or so, Social Security will kick in something. No, I don’t think it will disappear, and I don’t expect to be so rich as to not get anything. Finally, I expect to continue my low-demand freelance work and thus maintain a low level of income indefinitely.)
Posted in Goals, Investing, Real Estate, Retirement | 13 Comments »
Friday, July 8th, 2011
I was looking through the Barnes & Noble bargain bin and found a book called “How to do just about everything”. Okay, how to unplug a toilet… how to carve a turkey… hey, a personal finance section! Wow, quite awful. After coming home and looking up the book, I found out it was by eHow.com. I should have known. Check out this gem on How to Select a Good Mutual Fund (eHow link), which offers the following advice:
2. Determine how many mutual funds you will invest in. Three to five funds is generally considered an adequate amount of diversification.
Yes, let’s determine diversification by the actual number of funds. One… two… three… done! Never mind that I could easily have more diversification in one mutual fund than in 15 separate niche funds. This is like deciding the best book is the one with the most pages. At least later on it says to vary the size of companies in the funds. However, there is no mention of real diversification between stocks vs. bonds, domestic vs. international, passive vs. active management, etc. What else?
5. Choose high-performance funds by using Internet resources and newspapers to pick those funds that have had the best performance over at least the last three years.
Huh? I don’t know how the advice could get much worse than this. Picking whichever funds that had the best performance over the last three years will virtually guarantee that you will have below average returns going forward. Check out these articles on the persistence of mutual fund returns based on studies of actual mutual fund return data over decades. “The majority of well-done studies tend to support a lack of persistence for all but the worst performing equity mutual funds.”
Don’t chase performance! Again, we see no mention of better indicators like expense ratio, turnover ratio, tax-efficiency, manager ownership of shares, etc.
Content Mills Warning
So how does such a poor article get prominent placement in search engines, not to mention published in a book? eHow is a content mill that encourages people to churn out large numbers of articles with low quality standards, promising them a cut of all future ad revenue. Google has recently penalized them for their low-quality articles as well.
In addition, eHow has a history of treating their freelance writers poorly, and their most recent move was to cut off their share of ad revenue completely, offering them either a lowball buyout or nothing. I’m sure they have some good articles, but in general I would say you’re better off avoiding them, especially for money-related topics.
Posted in Investing | 9 Comments »