John Rekenthaler questions the industry-standard Target Date Fund glide path in the Morningstar article Should Target-Date Funds Allot More to Equities?. He runs tests comparing the traditional target date glide path alongside two alternatives:
- “Traditional” Target Date Glide Path: 85% stocks/15% bonds from ages 25 to 35. Stock % gradually decreases to 48% stocks from ages 35 to 65 (averages out to 70% stocks over the entire 40-year career).
- Flat Glide Path: 70% stocks/30% bonds constant for all 40 years.
- “Reverse” Target Date Glide Path: As another data point to explore, this starts at 48% and gradually increases to 85% stocks from 25 to 55 and then stays at 86% for age 55 yo 65 (last 10 years). Again, averages out to 70% stocks over the entire 40-year career.
This caught my eye because that’s pretty much my personal asset allocation: a fixed 70% stock/30% bond allocation that I intend to keep more or less forever. My background reasons are somewhat different, as my goal is a lower “perpetual” withdrawal rate from an earlier starting age than 65.
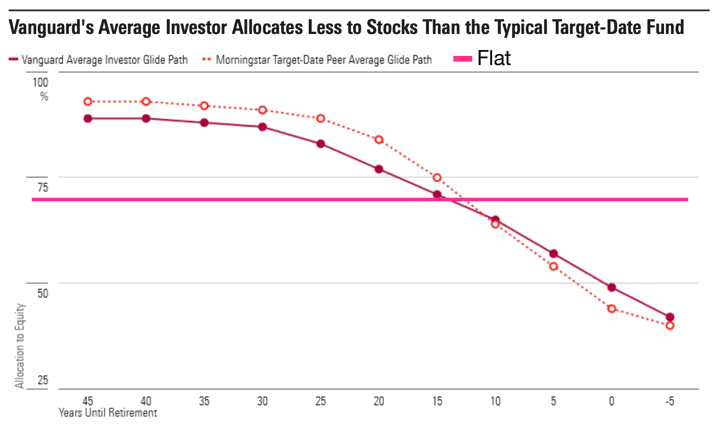
At the top of this post is a chart showing the average industry glide path alongside Vanguard’s popular fund series, also from Morningstar. I added the hot pink “Flat” line for illustration.
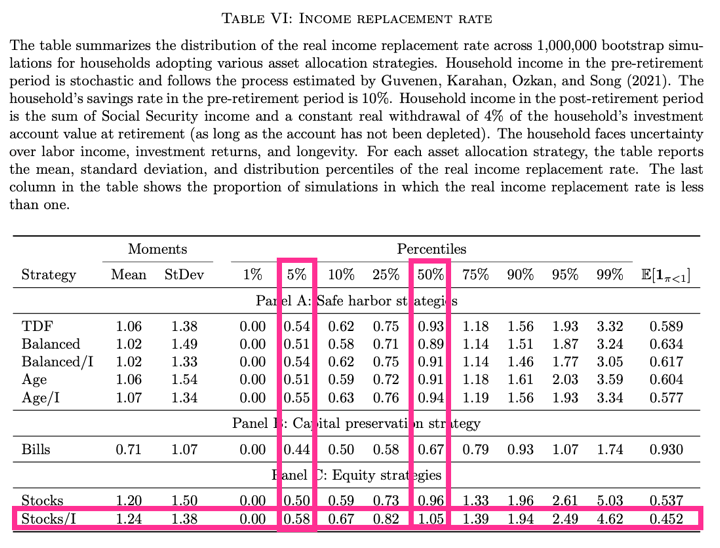
The article discusses many different wrinkles, but here is a chart summarizing the results based on the percentile scenario (99th is the 10th worst total return, 1st is nearly the best total return). Annual contributions start at $5,000, increase over the next 10 years to $10,000, increase again over the next 10 years to $15,000, and stay there (they also increase to adjust with inflation).
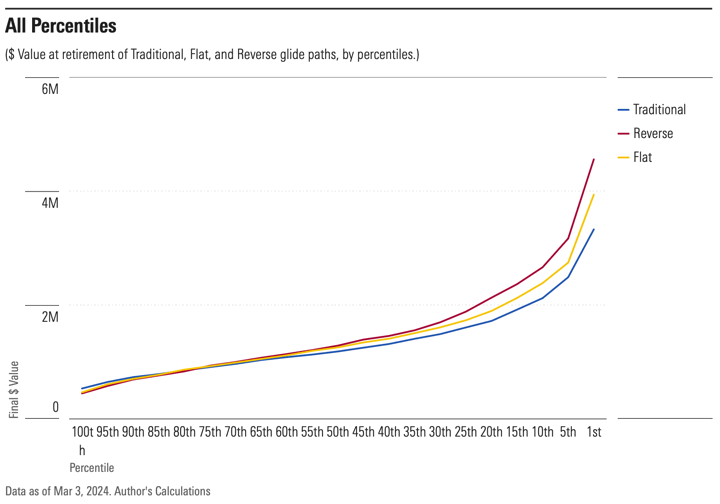
One way to summarize the results is that the Traditional glide path is relatively better in low return, worst-case scenarios. The Reverse glide path is relatively better in high return, best-case scenarios. The Flat strategy is in the middle, worse than Traditional in the low-return scenarios, but better than Traditional in the higher-return scenarios. The Traditional glide path is the most conservative with the most downside protection, which sounds like a reasonable choice for a default investment to me.
However, my personal takeaway is that there is less difference than you might think between the Flat and Traditional scenarios. Either one will work for the most part, as long as you stay invested the entire time. The most important factor is to pick the asset allocation method that lets you stay invested the entire time. For most people, I’d guess that is the default target date fund in their 401(k) plan. For me, I prefer my “perpetual” flat asset allocation that is closer to a classic balanced fund.
(I don’t see the Reverse scenario being very popular, but it might encourage some people to elevate their stock holdings over their entire career.)


 The Best Credit Card Bonus Offers – March 2024
 Big List of Free Stocks from Brokerage Apps
 Best Interest Rates on Cash - March 2024
 Free Credit Scores x 3 + Free Credit Monitoring
 Best No Fee 0% APR Balance Transfer Offers
 Little-Known Cellular Data Plans That Can Save Big Money
 How To Haggle Your Cable or Direct TV Bill
 Big List of Free Consumer Data Reports (Credit, Rent, Work)