Here’s my portfolio update for the third quarter of 2019. Most of my dividends arrive on a quarterly basis, and this helps me determine where to reinvest them. These are my real-world holdings, including 401k/403b/IRAs, taxable brokerage accounts, and savings bonds but excluding our house, cash reserves, and a few side investments. The goal of this portfolio is to create sustainable income that keeps up with inflation to cover our household expenses.
Actual Asset Allocation and Holdings
I use both Personal Capital and a custom Google Spreadsheet to track my investment holdings. The Personal Capital financial tracking app (free, my review) automatically logs into my accounts, adds up my balances, tracks my performance, and calculates my asset allocation. I still use my manual Google Spreadsheet (free, instructions) because it helps me calculate how much I need in each asset class to rebalance back towards my target asset allocation.
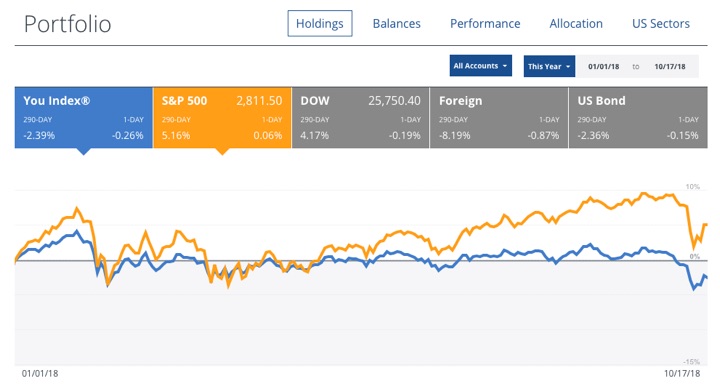
Here are my YTD performance and current asset allocation visually, per the “Holdings” and “Allocation” tabs of my Personal Capital account, respectively:
Stock Holdings
Vanguard Total Stock Market Fund (VTI, VTSAX)
Vanguard Total International Stock Market Fund (VXUS, VTIAX)
WisdomTree SmallCap Dividend ETF (DES)
Vanguard Small Value ETF (VBR)
Vanguard Emerging Markets ETF (VWO)
Vanguard REIT Index Fund (VNQ, VGSLX)
Bond Holdings
Vanguard Limited-Term Tax-Exempt Fund (VMLTX, VMLUX)
Vanguard Intermediate-Term Tax-Exempt Fund (VWITX, VWIUX)
Vanguard Intermediate-Term Treasury Fund (VFITX, VFIUX)
Vanguard Inflation-Protected Securities Fund (VIPSX, VAIPX)
Fidelity Inflation-Protected Bond Index Fund (FIPDX)
iShares Barclays TIPS Bond ETF (TIP)
Individual TIPS securities
U.S. Savings Bonds (Series I)
Target Asset Allocation. Our overall goal is to include asset classes that will provide long-term returns above inflation, distribute income via dividends and interest, and finally offer some historical tendencies to balance each other out. I make a small bet that US Small Value and Emerging Markets will have higher future long-term returns (along with some higher volatility) than the more large and broad indexes, although I could be wrong.
I don’t hold commodities, gold, or bitcoin. While you could argue for each of these asset classes, I believe that it is important to imagine an asset class doing poorly for a long time, with bad news constantly surrounding it, and only hold the ones where you still think you can maintain faith based on a solid foundation of knowledge and experience. That’s just not the case for me with certain asset classes.
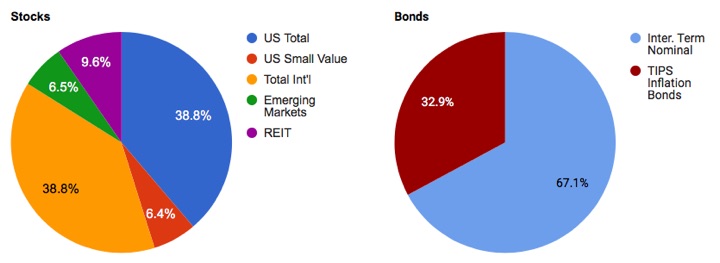
Stocks Breakdown
- 38% US Total Market
- 7% US Small-Cap Value
- 38% International Total Market
- 7% Emerging Markets
- 10% US Real Estate (REIT)
Bonds Breakdown
- 33% US Treasury Bonds, intermediate
- 33% High-Quality Municipal Bonds (taxable)
- 33% US Treasury Inflation-Protected Bonds (tax-deferred)
I have settled into a long-term target ratio of 67% stocks and 33% bonds (2:1 ratio) within our investment strategy of buy, hold, and occasionally rebalance. I will use the dividends and interest to rebalance whenever possible in order to avoid taxable gains. (I allow it drift a bit either way.) With a self-managed, simple portfolio of low-cost funds, we minimize management fees, commissions, and taxes.
Holdings commentary. On the stocks side, somehow despite all of the various news stories stock prices have been resilient. I’m like a lot of other people and waiting for the next recession to come, but I also know to stay in the game. US stocks have beaten international stocks for a while, but I remain satisfied with my mix, knowing that I will own whatever successful businesses come out of the US, China, or wherever in the future.
On the bond side, my primary objective is to hold high-quality bonds with a short-to-intermediate duration of under 5 years or so. This means US Treasuries, TIPS, or investment-grade municipal bonds. I don’t want to worry about my bonds. I then tweak the specific breakdown based on my tax-deferred space available, the tax-effective rates of muni bonds, and the real interest rates of TIPS. Right now, it is roughly 1/3rd Treasuries, 1/3 Muni bonds, and 1/3rd TIPS. It looks like I need to redirect my dividends into more bonds.
Performance commentary and benchmarks. According to Personal Capital, my portfolio went up 13% so far in 2019. I see that during the same period the S&P 500 has gone up nearly 20%, Foreign Developed stocks up nearly 13%, and the US Aggregate bond index was up about 7%.
An alternative benchmark for my portfolio is 50% Vanguard LifeStrategy Growth Fund and 50% Vanguard LifeStrategy Moderate Growth Fund – one is 60/40 and the other is 80/20 so it also works out to 70% stocks and 30% bonds. That benchmark would have a total return of +14.82% for 2019 YTD.
I’ll share about more about the income in a separate post.
 One of the biggest problems in retirement planning is making sure a pile of money lasts through your retirement. I have read hundreds of articles about this topic, and still haven’t a perfect solution to this problem. Most recently, I looked into the idea of


 We’re in the midst of an extended Spring Break vacation, so posting will be light for the next two weeks. I have some pre-written content scheduled, but the comment moderation may be delayed.
 The Best Credit Card Bonus Offers – March 2024
 Big List of Free Stocks from Brokerage Apps
 Best Interest Rates on Cash - March 2024
 Free Credit Scores x 3 + Free Credit Monitoring
 Best No Fee 0% APR Balance Transfer Offers
 Little-Known Cellular Data Plans That Can Save Big Money
 How To Haggle Your Cable or Direct TV Bill
 Big List of Free Consumer Data Reports (Credit, Rent, Work)