$6,000 IRA Contribution Goal 2022 Final Results: $6,259+ in Total Bonuses

My Money Blog has partnered with CardRatings and may receive a commission from card issuers. Some or all of the card offers that appear on this site are from advertisers and may impact how and where card products appear on the site. MyMoneyBlog.com does not include all card companies or all available card offers. All opinions expressed are the author’s alone.

2022 Year-End Update. Each year, I have a side goal of earning the equivalent of the maximum annual IRA contribution limit ($6,000 for 2022) using the profits from various finance promotions alone. In 2021, I reached $5,592 in bonuses and $2,500+ in extra interest. If you had put $6,000 into your IRA every year for the recent 10 year period (2013-2022) and invested in a simple Target Date retirement fund, you would have turned small, weekly deals into a $87,000+ nest egg.

That’s worth repeating: An extra 87 grand has been the real-world result of regularly investing $500 a month for 10 years! A couple could double these numbers.

Ground rules: Real-world results for one real person only. Following with My Money Blog tradition, this will track my personal, real-world results. It would be quite easy to list a bunch of random promotions that add up to $6,000, but these will be promotions that I personally sign up for and complete the requirements (even though I’ve already opened so many bank accounts, credit cards, and brokerage accounts over the years). I will track my individual results only, although my partner does also participate on a more selective basis. Nearly all of them have been documented in real-time in the Deals and Offers category, Top 10 credit cards list, and brokerage bonus list.

Note: I am also excluding the $900 bonus from Chase Ink Business Cash card, since it is meant for small businesses.

2022 bonuses and promotions list. The 💵 symbol means I have received and/or cashed out the bonus successfully. The ⌛ symbol means the promo is still in progress.

Bonuses that required significant assets to max out (but not necessarily participate)

2022 final results. The total tally for bonuses not requiring significant assets was $6,259 total for 2022, which was 104% of the $6,000 annual IRA contribution limit for 2022. This excludes the three bonuses (Public, SoFi, and Ally) that paid out bigger bonuses for larger asset transfers or cash deposits. I acknowledge not everyone has enough assets to max those out, but they were certainly an efficient use of time if you did. If you add in the $3,500 that I received from those bonuses, the total would be $9,759.

Additional background stuff. This is a personal challenge/game that I like to play. I enjoy trying out new apps and services. I look for the best payoff/effort ratio for my situation; your choices won’t look like my choices. In addition, some things I will skip simply because I’ve already done them. For those new to this hobby, I would first grab the low-hanging fruit like the Chase Sapphire Preferred or the Chase Sapphire Reserve and build up a nice stash of flexible Ultimate Rewards points. After that, I would recommend looking at the Citi Premier (ThankYou points), Capital Venture X (Capital One Miles), and American Express Gold (AmEX Membership Rewards points) to jumpstart your points stashes.

These numbers included fixed bonuses for short-term asset transfers, but ignore higher interest rates overall from buying US Treasury bonds or savings bonds. They also ignore ongoing credit card purchase rewards like 2% to 2.6% cash back on all credit purchases (or airline miles or hotel points) and 5% cash back on specific categories or 1% or better cash back on rent.

This is an enjoyable and profitable hobby for me, but I don’t like to waste my time either. I look for a solid return based on the time commitment required. I tend to avoid speculative bets, bonuses that are hard to convert to real value, and anything that requires driving to stores where things may or may not be in stock. The deals that I post usually last at least a few days, but it’s a bit like value investing where you have to be ready to get off your butt and take decisive action when an opportunity shows up, because they won’t last forever.

My Money Blog has partnered with CardRatings and may receive a commission from card issuers. Some or all of the card offers that appear on this site are from advertisers and may impact how and where card products appear on the site. MyMoneyBlog.com does not include all card companies or all available card offers. All opinions expressed are the author’s alone, and has not been provided nor approved by any of the companies mentioned.

MyMoneyBlog.com is also a member of the Amazon Associate Program, and if you click through to Amazon and make a purchase, I may earn a small commission. Thank you for your support.


MMB Portfolio 2022 Year-End Update: Dividend & Interest Income

My Money Blog has partnered with CardRatings and may receive a commission from card issuers. Some or all of the card offers that appear on this site are from advertisers and may impact how and where card products appear on the site. MyMoneyBlog.com does not include all card companies or all available card offers. All opinions expressed are the author’s alone.

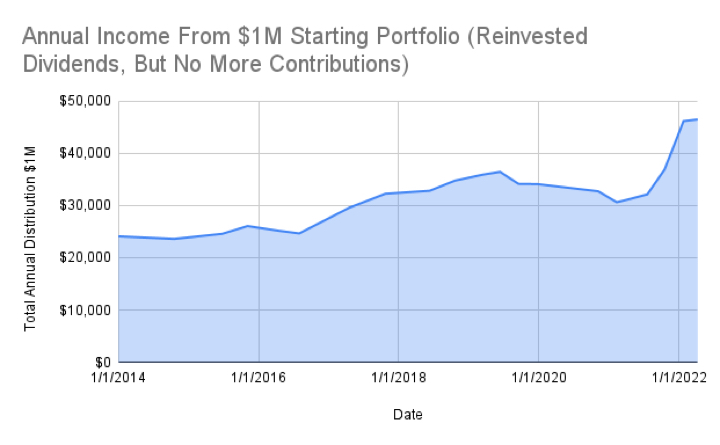
Here’s my 2022 Year-End income update for my Humble Portfolio. I track the income produced as an alternative metric for performance. The total income goes up much more gradually and consistently than the number shown on brokerage statements (price), which helps encourage consistent investing. I imagine my portfolio as a factory that churns out dollar bills.

Short recap about dividends. Stock dividends are a portion of net profits that businesses have decided to distribute directly to shareholders, as opposed to reinvesting into their business, paying back debt, or buying back shares directly. The dividends may suffer some short-term drops, but over the long run they have grown faster than inflation.

In the US, the dividend culture is somewhat conservative in that shareholders expect dividends to be stable and only go up. Thus the starting yield is lower, but grows more steadily with smaller cuts during hard times. Here is the historical growth of the trailing 12-month (ttm) dividend paid by the Vanguard Total US Stock ETF (VTI), courtesy of StockAnalysis.com. Unfortunately, they recently shortened their lookback period on their charts.

European corporate culture tends to encourage paying out a higher (sometimes fixed) percentage of earnings as dividends, but that also means the dividends move up and down with earnings. Thus the starting yield is higher but may not grow as reliably. Here is the historical growth of the trailing 12-month (ttm) dividend paid by the Vanguard Total International Stock ETF (VXUS).

The dividend yield (dividends divided by price) also serve as a rough valuation metric. When stock prices drop, this percentage metric usually goes up – which makes me feel better in a bear market. When stock prices go up, this percentage metric usually goes down, which keeps me from getting too euphoric during a bull market. Here’s a related quote from Jack Bogle (source):

The true investor will do better if he forgets about the stock market and pays attention to his dividend returns and to the operating results of his companies.

My personal portfolio income history. I started tracking the income from my portfolio in 2014. Here’s what the annual distributions from my portfolio look like over time:

  • $1,000,000 invested in my portfolio as of January 2014 would have generated about $24,000 in annual income over the previous 12 months. (2.4% starting yield)
  • If I reinvested the income but added no other contributions, over the year of 2022 it would have generated ~$51,500 in annual income over the previous 12 months.

This chart shows how the annual income generated by my portfolio has increased over time and with dividend reinvestment.

TTM income yield. To estimate the income from my portfolio, I use the weighted “TTM” or “12-Month Yield” from Morningstar (checked 1/6/23), which is the sum of the trailing 12 months of interest and dividend payments divided by the last month’s ending share price (NAV) plus any capital gains distributed (usually zero for index funds) over the same period. The trailing income yield for this quarter was 3.33%, as calculated below. Then I multiply by the current balance from my brokerage statements to get the total income.

Asset Class / Fund % of Portfolio Trailing 12-Month Yield Yield Contribution
US Total Stock (VTI) 30% 1.66% 0.50%
US Small Value (VBR) 5% 2.03% 0.10%
Int’l Total Stock (VXUS) 20% 3.09% 0.62%
Int’l Small Value (AVDV/EYLD) 5% 4.36% 0.22%
US Real Estate (VNQ) 10% 3.91% 0.39%
Inter-Term US Treasury Bonds (VGIT) 15% 1.74% 0.26%
Inflation-Linked Treasury Bonds (TIP) 15% 6.96% 1.04%
Totals 100% 3.13%


My ttm portfolio yield is now roughly 3.13%, a bit lower than last quarter’s value. (This is not the same as the dividend yield commonly reported in stock quotes, which just multiplies the last quarterly dividend by four.) US dividends went up a bit, international dividends went down a bit, Treasury bond yield is catching up, TIPS yield is still high from tracking CPI inflation.

What about the 4% rule? For goal planning purposes, I support the simple 4% or 3% rule of thumb, which equates to a target of accumulating roughly 25 to 33 times your annual expenses. I would lean towards a 3% withdrawal rate if you want to retire young (before age 50) and a 4% withdrawal rate if retiring at a more traditional age (closer to 65). It’s just a quick and dirty target, not a number sent down from the heavens. I keep the 3% number in mind, while also tracking dividends and interest (and inflation). During the accumulation stage, your time is better spent focusing on earning potential via better career moves, improving in your skillset, and/or looking for entrepreneurial opportunities where you can have an ownership interest.

As a semi-retired investor that has been partially supported by portfolio income for a while, I find that tracking income makes more tangible sense in my mind and is more useful for those who aren’t looking for a traditional retirement. Our dividends and interest income are not automatically reinvested. They are another “paycheck”. Then, as with a traditional paycheck, we can choose to either spend it or invest it again to compound things more quickly. Even if we spend the dividends, this portfolio paycheck will still grow over time. You could use this money to cut back working hours, pursue a different career path, start a new business, take a sabbatical, perform charity or volunteer work, and so on.

Right now, I am happily in the “my kids still think I’m cool and want to spend time with me” zone. I am consciously choosing to work when they are at school but also consciously turning down work that doesn’t fit my priorities and goals. This portfolio income helps me do that.

My Money Blog has partnered with CardRatings and may receive a commission from card issuers. Some or all of the card offers that appear on this site are from advertisers and may impact how and where card products appear on the site. MyMoneyBlog.com does not include all card companies or all available card offers. All opinions expressed are the author’s alone, and has not been provided nor approved by any of the companies mentioned.

MyMoneyBlog.com is also a member of the Amazon Associate Program, and if you click through to Amazon and make a purchase, I may earn a small commission. Thank you for your support.


MMB Humble Portfolio 2022 Year-End Update: Asset Allocation & Performance

My Money Blog has partnered with CardRatings and may receive a commission from card issuers. Some or all of the card offers that appear on this site are from advertisers and may impact how and where card products appear on the site. MyMoneyBlog.com does not include all card companies or all available card offers. All opinions expressed are the author’s alone.

portpie_blank200
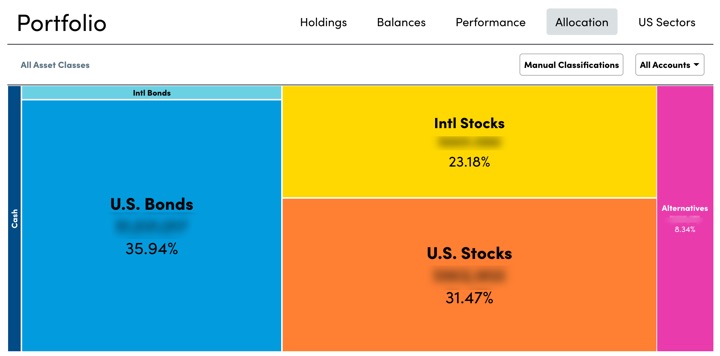
Here’s my quarterly update on my current investment holdings as of the end of 2022, including our 401k/403b/IRAs and taxable brokerage accounts but excluding real estate and side portfolio of self-directed investments. Following the concept of skin in the game, the following is not a recommendation, but just to share our real, imperfect, low-cost, diversified DIY portfolio. Wouldn’t it be nice if everyone else did the same? (Many people do track the 13F filings of well-known investors.)

“Never ask anyone for their opinion, forecast, or recommendation. Just ask them what they have in their portfolio.” – Nassim Taleb

How I Track My Portfolio
Here’s how I track my portfolio across multiple brokers and account types. There are limited free options nowadays as Morningstar recently discontinued free access to their portfolio tracker. I use both Personal Capital and a custom Google Spreadsheet to track my investment holdings:

End of 2022 Asset Allocation and YTD Performance
Here are updated performance and asset allocation charts, per the “Allocation” and “Holdings” tabs of my Personal Capital account.

Target Asset Allocation. I call this my “Humble Portfolio” because it accepts the repeated findings that individuals cannot reliably time the market, and that persistence in above-average stock-picking and/or sector-picking is exceedingly rare. Costs matter and nearly everyone who sells outperformance, for some reason keeps charging even if they provide zero outperformance! By paying minimal costs including management fees and tax drag, you can essentially guarantee yourself above-average net performance over time.

I own broad, low-cost exposure to productive assets that will provide long-term returns above inflation, distribute income via dividends and interest, and finally offer some historical tendencies to balance each other out. I have faith in the long-term benefit of owning businesses worldwide, as well as the stability of high-quality US Treasury debt. My stock holdings roughly follow the total world market cap breakdown at roughly 60% US and 40% ex-US. I add just a little “spice” to the vanilla funds with the inclusion of “small value” ETFs for US, Developed International, and Emerging Markets stocks as well as additional real estate exposure through US REITs.

I strongly believe in the importance of knowing WHY you own something. Every asset class will eventually have a low period, and you must have strong faith during these periods to truly make your money. You have to keep owning and buying more stocks through the stock market crashes. You have to maintain and even buy more rental properties during a housing crunch, etc. A good sign is that if prices drop, you’ll want to buy more of that asset instead of less. I don’t have strong faith in the long-term results of commodities, gold, or bitcoin – so I don’t own them.

I do not spend a lot of time backtesting various model portfolios, as I don’t think picking through the details of the recent past will necessarily create superior future returns. You’ll find that whatever model portfolio is popular in the moment just happens to hold the asset class that has been the hottest recently as well.

Find productive assets that you believe in and understand, and just keep buying them through the ups and downs. Mine may be different than yours.

I have settled into a long-term target ratio of roughly 70% stocks and 30% bonds (or 2:1 ratio) within our investment strategy of buy, hold, and occasionally rebalance. My goal is more “perpetual income portfolio” as opposed to the more common “build up a big stash and hope it lasts until I die” portfolio. My target withdrawal rate is 3% or less. Here is a round-number breakdown of my target asset allocation.

  • 30% US Total Market
  • 5% US Small-Cap Value
  • 20% International Total Market
  • 5% International Small-Cap Value
  • 10% US Real Estate (REIT)
  • 15% US Treasury Nominal Bonds or FDIC-insured deposits
  • 15% US Treasury Inflation-Protected Bonds (or I Savings Bonds)

Commentary. The goal of this “Humble Portfolio” is to create sustainable income that keeps up with inflation to cover our household expenses. According to Personal Capital, my portfolio went down about 16% for 2022. There was only a little minor rebalancing to be done this quarter.

Due to the rising real yield on TIPS, I have shifted back to a target bond allocation of roughly 50% US Treasury/Bank CDs and 50% TIPS/I Savings Bonds. My traditional Treasuries are of intermediate term, and I may convert to a manual ladder of them in the future. My TIPS are also of intermediate to long-term, depending on the real yields available at the time of purchase. I have been manually buying individual TIPS of longer terms this quarter. 1.6% real yield may not be terribly exciting, but it’s a lot better that was available for a long time, and it may be better that what will be available in the future.

I’ll share about more about the income aspect in a separate post.

My Money Blog has partnered with CardRatings and may receive a commission from card issuers. Some or all of the card offers that appear on this site are from advertisers and may impact how and where card products appear on the site. MyMoneyBlog.com does not include all card companies or all available card offers. All opinions expressed are the author’s alone, and has not been provided nor approved by any of the companies mentioned.

MyMoneyBlog.com is also a member of the Amazon Associate Program, and if you click through to Amazon and make a purchase, I may earn a small commission. Thank you for your support.


MMB Portfolio 2022 3rd Quarter Update: Dividend & Interest Income

My Money Blog has partnered with CardRatings and may receive a commission from card issuers. Some or all of the card offers that appear on this site are from advertisers and may impact how and where card products appear on the site. MyMoneyBlog.com does not include all card companies or all available card offers. All opinions expressed are the author’s alone.

Here’s my quarterly income update for my Humble Portfolio (2022 Q3). I track the income produced as an alternative metric for performance. The total income goes up much more gradually and consistently than the number shown on brokerage statements (price), which helps encourage consistent investing. Imagine your portfolio as a factory that churns out dollar bills.

Background: Overall stock market dividend growth. Stock dividends are a portion of net profits that businesses have decided to distribute directly to shareholders, as opposed to reinvesting into their business, paying back debt, or buying back shares directly. The dividends may suffer some short-term drops, but over the long run they have grown faster than inflation.

In the US, the dividend culture is somewhat conservative in that shareholders expect dividends to be stable and only go up. Thus the starting yield is lower, but grows more steadily with smaller cuts during hard times. Here is the historical growth of the trailing 12-month (ttm) dividend paid by the Vanguard Total US Stock ETF (VTI), courtesy of StockAnalysis.com. Currently, 31% of VTI’s net earnings are sent to you as a dividend. Notice how it grows gradually, with the current annual dividend 80% higher than in September 2013:

European corporate culture tends to encourage paying out a higher (sometimes fixed) percentage of earnings as dividends, but that means the dividends move up and down with earnings. Thus the starting yield is higher but may not grow as reliably. Here is the historical growth of the trailing 12-month (ttm) dividend paid by the Vanguard Total International Stock ETF (VXUS). Currently, 47% of VXUS’s net earnings are sent to you as a dividend. Notice how it stays more stable (but also dropped during 2020 due to COVID), with the current annual dividend only 20% higher than in September 2013:

The dividend yield (dividends divided by price) also serve as a rough valuation metric. When stock prices drop, this percentage metric usually goes up – which makes me feel better in a bear market. When stock prices go up, this percentage metric usually goes down, which keeps me from getting too euphoric during a bull market. Here’s a related quote from Jack Bogle (source):

The true investor will do better if he forgets about the stock market and pays attention to his dividend returns and to the operating results of his companies.

My personal portfolio income history. I started tracking the income from my portfolio in 2014. Here’s what the annual distributions from my portfolio look like over time:

  • $1,000,000 invested in my portfolio as of January 2014 would have generated about $24,000 in annual income over the previous 12 months. (2.4% starting yield)
  • If I reinvested the income but added no other contributions, today in 2022 it would have generated ~$53,000 in annual income over the previous 12 months.

This chart shows how the total annual income generated by my portfolio has changed. It’s not all about current yield.

TTM income yield. To estimate the income from my portfolio, I use the weighted “TTM” or “12-Month Yield” from Morningstar (checked 10/5/22), which is the sum of the trailing 12 months of interest and dividend payments divided by the last month’s ending share price (NAV) plus any capital gains distributed (usually zero for index funds) over the same period. The trailing income yield for this quarter was 3.33%, as calculated below. Then I multiply by the current balance from my brokerage statements to get the total income.

Asset Class / Fund % of Portfolio Trailing 12-Month Yield Yield Contribution
US Total Stock (VTI) 25% 1.74% 0.44%
US Small Value (VBR) 5% 2.30% 0.12%
Int’l Total Stock (VXUS) 25% 4.18% 1.05%
Emerging Markets (VWO) 5% 3.95% 0.20%
US Real Estate (VNQ) 6% 3.89% 0.23%
Inter-Term US Treasury Bonds (VGIT) 17% 1.42% 0.24%
Inflation-Linked Treasury Bonds (VTIP) 17% 6.24% 1.06%
Totals 100% 3.33%


Commentary. My ttm portfolio yield is now roughly 3.33%. (This is not the same as the dividend yield commonly reported in stock quotes, which just multiplies the last quarterly dividend by four.) Both US and international stock prices have gone down, and my ttm dividend yield has gone up. The price of my Treasury bonds have also gone down as nominal rates have gone up, but the yield will eventually go up as the money is reinvested into new bonds at higher rates. My TIPS yield has gone up significantly as it tracks CPI inflation. Of course, the NAV on my TIPS has also gone down, as real yields have gone up (again will be better as money is reinvested). TIPS are a bit complicated like that.

Use as a retirement planning metric. For goal planning purposes, I support the simple 4% or 3% rule of thumb, which equates to a target of accumulating roughly 25 to 33 times your annual expenses. I would lean towards a 3% withdrawal rate if you want to retire young (before age 50) and a 4% withdrawal rate if retiring at a more traditional age (closer to 65). It’s just a useful target, not a number sent down from a higher being. During the accumulation stage, your time is better spent focusing on earning potential via better career moves, improving in your skillset, and/or looking for entrepreneurial opportunities where you can have an ownership interest.

Even if do you reach that 25X or 30X goal, it’s just a moment in time. The market can shift, your expenses can shift, and so I find that tracking income makes more tangible sense in my mind and is more useful for those who aren’t looking for a traditional retirement. Our dividends and interest income are not automatically reinvested. They are another “paycheck”. Then, as with a traditional paycheck, we can choose to either spend it or invest it again to compound things more quickly. Even if we spend the dividends, this portfolio paycheck will still grow over time. You could use this money to cut back working hours, pursue a different career path, start a new business, take a sabbatical, perform charity or volunteer work, and so on.

Right now, I am happily in the “my kids still think I’m cool and want to spend time with me” zone. I am consciously choosing to work when they are at school but also consciously turning down any more work past that. This portfolio income helps me do that.

My Money Blog has partnered with CardRatings and may receive a commission from card issuers. Some or all of the card offers that appear on this site are from advertisers and may impact how and where card products appear on the site. MyMoneyBlog.com does not include all card companies or all available card offers. All opinions expressed are the author’s alone, and has not been provided nor approved by any of the companies mentioned.

MyMoneyBlog.com is also a member of the Amazon Associate Program, and if you click through to Amazon and make a purchase, I may earn a small commission. Thank you for your support.


MMB Humble Portfolio 2022 3rd Quarter Update: Asset Allocation & Performance

My Money Blog has partnered with CardRatings and may receive a commission from card issuers. Some or all of the card offers that appear on this site are from advertisers and may impact how and where card products appear on the site. MyMoneyBlog.com does not include all card companies or all available card offers. All opinions expressed are the author’s alone.

portpie_blank200Here’s my quarterly update on my current investment holdings as of 10/4/22, including our 401k/403b/IRAs and taxable brokerage accounts but excluding real estate and side portfolio of self-directed investments. Following the concept of skin in the game, the following is not a recommendation, but just to share our real, imperfect, low-cost, diversified DIY portfolio. The goal of this “Humble Portfolio” is to create sustainable income that keeps up with inflation to cover our household expenses.

“Never ask anyone for their opinion, forecast, or recommendation. Just ask them what they have in their portfolio.” – Nassim Taleb

How I Track My Portfolio
I’m often asked how I track my portfolio across multiple brokers and account types. There are limited free options nowadays as Morningstar recently discontinued free access to their portfolio tracker. I use both Personal Capital and a custom Google Spreadsheet to track my investment holdings:

  • The Personal Capital financial tools and real-time tracking (free, my review) automatically logs into my different accounts, adds up my various balances, tracks my performance, and calculates my overall asset allocation daily.
  • Once a quarter, I also update my manual Google Spreadsheet (free, instructions) because it helps me calculate how much I need in each asset class to rebalance back towards my target asset allocation. I also create a new tab each quarter, so I have snapshot of my holdings dating back many years.

October 2022 Asset Allocation and YTD Performance
Here are updated performance and asset allocation charts, per the “Allocation” and “Holdings” tabs of my Personal Capital account.

Target Asset Allocation. I call this my “Humble Portfolio” because it accepts the repeated findings that individuals cannot reliably time the market, and that persistence in above-average stock-picking and/or sector-picking is exceedingly rare. Costs matter and nearly everyone who sells outperformance, for some reason keeps charging even if they provide zero outperformance! By paying minimal costs including management fees and tax drag, you can actually guarantee yourself above-average net performance over time.

I own broad, low-cost exposure to productive assets that will provide long-term returns above inflation, distribute income via dividends and interest, and finally offer some historical tendencies to balance each other out. I have faith in the long-term benefit of owning publicly-traded US and international shares of businesses, as well as the stability of high-quality US Treasury and municipal debt. My stock holdings roughly follow the total world market cap breakdown at roughly 60% US and 40% ex-US. I add just a little “spice” to the vanilla funds with the inclusion of “small value” ETFs for US, Developed International, and Emerging Markets stocks as well as additional real estate exposure through US REITs.

I strongly believe in the importance of knowing WHY you own something. Every asset class will eventually have a low period, and you must have strong faith during these periods to truly make your money. You have to keep owning and buying more stocks through the stock market crashes. You have to maintain and even buy more rental properties during a housing crunch, etc. A good sign is that if prices drop, you’ll want to buy more of that asset instead of less. I don’t have strong faith in the long-term results of commodities, gold, or bitcoin – so I don’t own them.

I do not spend a lot of time backtesting various model portfolios, as I don’t think picking through the details of the recent past will necessarily create superior future returns. Usually, whatever model portfolio is popular in the moment just happens to hold the asset class that has been the hottest recently as well.

Find productive assets that you believe in and understand, and just keep buying them through the ups and downs. Mine may be different than yours.

I have settled into a long-term target ratio of roughly 70% stocks and 30% bonds (or 2:1 ratio) within our investment strategy of buy, hold, and occasionally rebalance. This is more conservative than most people my age, but I am settling into a more “perpetual income portfolio” as opposed to the more common “build up a big stash and hope it lasts until I die” portfolio. My target withdrawal rate is 3% or less. Here is a round-number breakdown of my target portfolio.

  • 30% US Total Market
  • 5% US Small-Cap Value
  • 20% International Total Market
  • 5% International Small-Cap Value
  • 10% US Real Estate (REIT)
  • 20% US Treasury Nominal Bonds or FDIC-insured deposits
  • 10% US Treasury Inflation-Protected Bonds (or I Savings Bonds)

Commentary. According to Personal Capital, my portfolio down about 18% for 2022 YTD. My US and International stocks have dropped again (even more than the bonds, which also dropped) and so available cashflow is being placed into buying more of those asset classes.

During this last quarter, I sold all of my municipal bonds and bought US Treasuries instead. Due to the rising rates, I had no capital gains to worry about. When I previously cycled into muni bonds, munis were yielding 24% more than Treasuries even before accounting for the tax benefits. In September 2015, I compared the 1.78% SEC yield of Vanguard Intermediate-Term Tax-Exempt Investor Shares (VWITX) to the 1.48% SEC yield of Vanguard Intermediate-Term Treasury Investor Shares (VFITX). The ratio was 1.24. As of October 2022, the ratio is now 0.93 (3.26% vs. 3.51%). At those levels, I am getting compensated much less for the additional risk of municipal finances. My bond portfolio is now US Treasury bonds, bank/credit union CDs (bought if/when the rates exceed US Treasuries), TIPS, and savings I bonds. Can’t get higher quality than that.

I take solace that for now I see more shrinking P/E ratios as opposed to crashing earnings on the stocks side, my REITs are yielding more, and my bonds are yielding more. One good thing about more “normal” interest rates if they can hold is that it gives conservative (often older) savers a chance to keep their principal safe and still earn a small bit of income without market volatility. My primary fear remains that of war.

I’ll share about more about the income aspect in a separate post.

My Money Blog has partnered with CardRatings and may receive a commission from card issuers. Some or all of the card offers that appear on this site are from advertisers and may impact how and where card products appear on the site. MyMoneyBlog.com does not include all card companies or all available card offers. All opinions expressed are the author’s alone, and has not been provided nor approved by any of the companies mentioned.

MyMoneyBlog.com is also a member of the Amazon Associate Program, and if you click through to Amazon and make a purchase, I may earn a small commission. Thank you for your support.


MMB Portfolio 2022 2nd Quarter Update: Dividend & Interest Income

My Money Blog has partnered with CardRatings and may receive a commission from card issuers. Some or all of the card offers that appear on this site are from advertisers and may impact how and where card products appear on the site. MyMoneyBlog.com does not include all card companies or all available card offers. All opinions expressed are the author’s alone.

via GIPHY

Here’s my quarterly update on the income produced by my Humble Portfolio (2022 Q2). I track the income produced as an alternative metric for performance. The total income goes up much more gradually and consistently than the number shown on brokerage statements (price), which helps encourage consistent investing. I imagine them as building up a factory that churns out dollar bills. You can still track your dividend and interest income with a total return portfolio. You don’t need a bunch of high-yield stocks, MLPs, leveraged REITs, or covered call ETFs.

Background: Overall stock market dividend growth. Stock dividends are a portion of net profits that businesses have decided to distribute directly to shareholders, as opposed to reinvesting into their business, paying back debt, or buying back shares directly. The dividends may suffer some short-term drops, but over the long run they have grown faster than inflation.

In the US, the dividend culture is somewhat conservative in that shareholders expect dividends to be stable and only go up. Dividend cuts tend to be avoided. Thus the starting yield is lower, but it can grow faster. Here is the historical growth of the trailing 12-month (ttm) dividend paid by the Vanguard Total US Stock ETF (VTI), courtesy of StockAnalysis.com. Currently, 31% of VTI’s net earnings are sent to you as a dividend. Notice how it grows gradually, with the current annual dividend 76% higher than in September 2013:

European corporate culture tends to encourage paying out a higher (sometimes fixed) percentage of earnings as dividends, but that means the dividends move up and down with earnings. Thus the starting yield is higher but may not grow as fast. Here is the historical growth of the trailing 12-month (ttm) dividend paid by the Vanguard Total International Stock ETF (VXUS). Currently, 47% of VXUS’s net earnings are sent to you as a dividend. Notice how it stays more stable (but also dropped during 2020 due to COVID), with the current annual dividend only 25% higher than in September 2013:

The dividend yield (dividends divided by price) also serve as a rough valuation metric. When stock prices drop, this percentage metric usually goes up – which makes me feel better in a bear market. When stock prices go up, this percentage metric usually goes down, which keeps me from getting too euphoric during a bull market. Here’s a related quote from Jack Bogle (source):

The true investor will do better if he forgets about the stock market and pays attention to his dividend returns and to the operating results of his companies.

My personal portfolio income history. I started tracking the income from my portfolio in 2014. Here’s what the annual distributions from my portfolio look like over time:

  • $1,000,000 invested in my portfolio as of January 2014 would have generated about $24,000 in annual income over the previous 12 months. (2.4% starting yield)
  • If I reinvested the income but added no other contributions, today in 2022 it would have generated ~$48,000 in annual income over the previous 12 months.

This chart shows how the annual income generated by my portfolio has changed.

TTM income yield. To estimate the income from my portfolio, I use the weighted “TTM” or “12-Month Yield” from Morningstar, which is the sum of the trailing 12 months of interest and dividend payments divided by the last month’s ending share price (NAV) plus any capital gains distributed (usually zero for index funds) over the same period. The trailing income yield for this quarter was 2.99%, as calculated below. Then I multiply by the current balance from my brokerage statements to get the total income.

Asset Class / Fund % of Portfolio Trailing 12-Month Yield Yield Contribution
US Total Stock (VTI) 25% 1.61% 0.40%
US Small Value (VBR) 5% 2.12% 0.11%
Int’l Total Stock (VXUS) 25% 3.87% 0.97%
Emerging Markets (VWO) 5% 3.35% 0.17%
US Real Estate (VNQ) 6% 3.14% 0.19%
Inter-Term US Treasury Bonds (VGIT) 17% 1.25% 0.21%
Inflation-Linked Treasury Bonds (VTIP) 17% 5.59% 0.95%
Totals 100% 2.99%


Commentary. My ttm yield is now ~3%. Both US and international stock prices have gone down, and my ttm dividend yield has gone up. The price of my Treasury bonds have also gone down as nominal rates have gone up, but the yield will eventually go up as the money is reinvested into new bonds at higher rates. My TIPS yield has gone up significantly as CPI inflation has spiked. Of course, the NAV on my TIPS has also gone down, as real yields have gone up (again will be better as money is reinvested). TIPS are a bit complicated like that.

Use as a retirement planning metric. As a very rough goal, I support the simple 4% or 3% rule of thumb, which equates to a target of accumulating roughly 25 to 33 times your annual expenses. I would lean towards a 3% withdrawal rate if you want to retire young (before age 50) and a 4% withdrawal rate if retiring at a more traditional age (closer to 65). It’s just a target, not a number sent down from a higher being. During the accumulation stage, your time is better spent focusing on earning potential via better career moves, improving in your skillset, and/or looking for entrepreneurial opportunities where you can have an ownership interest.

Even if do you reach that 25X or 30X goal, it’s just a moment in time. The market can shift, your expenses can shift, and so I find that tracking income makes more tangible sense in my mind and is more useful for those who aren’t looking for a traditional retirement. Our dividends and interest income are not automatically reinvested. They are another “paycheck”. Then, as with a traditional paycheck, we can choose to either spend it or invest it again to compound things more quickly. Even if we spend the dividends, this portfolio paycheck will still grow over time. You could use this money to cut back working hours, pursue a different career path, start a new business, take a sabbatical, perform charity or volunteer work, and so on. This is your one life and it only lasts about 4,000 weeks.

My Money Blog has partnered with CardRatings and may receive a commission from card issuers. Some or all of the card offers that appear on this site are from advertisers and may impact how and where card products appear on the site. MyMoneyBlog.com does not include all card companies or all available card offers. All opinions expressed are the author’s alone, and has not been provided nor approved by any of the companies mentioned.

MyMoneyBlog.com is also a member of the Amazon Associate Program, and if you click through to Amazon and make a purchase, I may earn a small commission. Thank you for your support.


MMB Humble Portfolio 2022 2nd Quarter Update: Asset Allocation & Performance

My Money Blog has partnered with CardRatings and may receive a commission from card issuers. Some or all of the card offers that appear on this site are from advertisers and may impact how and where card products appear on the site. MyMoneyBlog.com does not include all card companies or all available card offers. All opinions expressed are the author’s alone.

portpie_blank200Here’s my quarterly update on my current investment holdings as of 7/8/22, including our 401k/403b/IRAs and taxable brokerage accounts but excluding real estate and side portfolio of self-directed investments. Following the concept of skin in the game, the following is not a recommendation, but just to share an real, imperfect, low-cost, diversified DIY portfolio. The goal of this “Humble Portfolio” is to create sustainable income that keeps up with inflation to cover our household expenses.

“Never ask anyone for their opinion, forecast, or recommendation. Just ask them what they have in their portfolio.” – Nassim Taleb

TL;DR changes: Went from 67/33 stocks/bonds ratio to 64/36, so buying more US and International Stocks with available cashflow.

How I Track My Portfolio
I’m often asked how I track my portfolio across multiple brokers and account types. (Morningstar also recently discontinued free access to their portfolio tracker.) I use both Personal Capital and a custom Google Spreadsheet to track my investment holdings:

  • The Personal Capital financial tracking app (free, my review) automatically logs into my different accounts, adds up my various balances, tracks my performance, and calculates my overall asset allocation daily.
  • Once a quarter, I also update my manual Google Spreadsheet (free, instructions) because it helps me calculate how much I need in each asset class to rebalance back towards my target asset allocation. I also create a new tab each quarter, so I have snapshot of my holdings dating back many years.

July 2022 Asset Allocation and YTD Performance
Here are updated performance and asset allocation charts, per the “Allocation” and “Holdings” tabs of my Personal Capital account.

Target Asset Allocation. I call this my “Humble Portfolio” because it accepts the repeated findings that individuals cannot reliably time the market, and that persistence in above-average stock-picking and/or sector-picking is exceedingly rare. Costs matter and nearly everyone who sells outperformance, for some reason keeps charging even if they provide zero outperformance! By paying minimal costs including management fees and tax drag, you can actually guarantee yourself above-average net performance over time.

I own broad, low-cost exposure to productive assets that will provide long-term returns above inflation, distribute income via dividends and interest, and finally offer some historical tendencies to balance each other out. I have faith in the long-term benefit of owning publicly-traded US and international shares of businesses, as well as the stability of high-quality US Treasury and municipal debt. My stock holdings roughly follow the total world market cap breakdown at roughly 60% US and 40% ex-US. I add some “spice” to the vanilla funds with the inclusion of “small value” ETFs for US, Developed International, and Emerging Markets stocks as well as additional real estate exposure through US REITs.

I strongly believe in the importance of knowing WHY you own something. Every asset class will eventually have a low period, and you must have strong faith during these periods to truly make your money. You have to keep owning and buying more stocks through the stock market crashes. You have to maintain and even buy more rental properties during a housing crunch, etc. A good sign is that if prices drop, you’ll want to buy more of that asset instead of less. I don’t have strong faith in the long-term results of commodities, gold, or bitcoin – so I don’t own them.

I do not spend a lot of time backtesting various model portfolios, as I don’t think picking through the details of the recent past will necessarily create superior future returns. Usually, whatever model portfolio is popular in the moment just happens to hold the asset class that has been the hottest recently as well.

Find productive assets that you believe in and understand, and just keep buying them through the ups and downs. Mine may be different than yours.

I have settled into a long-term target ratio of roughly 70% stocks and 30% bonds (or 2:1 ratio) within our investment strategy of buy, hold, and occasionally rebalance. This is more conservative than most people my age, but I am settling into a more “perpetual income portfolio” as opposed to the more common “build up a big stash and hope it lasts until I die” portfolio. My target withdrawal rate is 3% or less. Here is a round-number breakdown of my target portfolio.

  • 30% US Total Market
  • 5% US Small-Cap Value
  • 20% International Total Market
  • 5% International Small-Cap Value
  • 10% US Real Estate (REIT)
  • 20% High-Quality bonds, Municipal, US Treasury or FDIC-insured deposits
  • 10% US Treasury Inflation-Protected Bonds (or I Savings Bonds)

Commentary. According to Personal Capital, my portfolio down about 16% for 2022 YTD. My US and International stocks have dropped enough that all new cashflow is being placed into buying more of those asset classes. Simple as that. Keep on truckin’.

Since that was so short and boring, here a quick fact that I keep in my head. Using the “Rule of 72”, we know that if your portfolio returns 7% a year, it will double roughly every 10 years. $10,000 invested for 10 years will double to $20,000. However, $10,000 invested for 20 years will quadruple into $40,000. $10,000 invested for 30 years will octuple into $80,000. That provides a sense of the power of compounding and how it starts slow but kicks into turbo mode later on. I’ve been investing for about 20 years, so I’m getting to the good part! 😉

I’ll share about more about the income aspect in a separate post.

My Money Blog has partnered with CardRatings and may receive a commission from card issuers. Some or all of the card offers that appear on this site are from advertisers and may impact how and where card products appear on the site. MyMoneyBlog.com does not include all card companies or all available card offers. All opinions expressed are the author’s alone, and has not been provided nor approved by any of the companies mentioned.

MyMoneyBlog.com is also a member of the Amazon Associate Program, and if you click through to Amazon and make a purchase, I may earn a small commission. Thank you for your support.


MMB Portfolio 2022 1st Quarter Update: Dividend & Interest Income

My Money Blog has partnered with CardRatings and may receive a commission from card issuers. Some or all of the card offers that appear on this site are from advertisers and may impact how and where card products appear on the site. MyMoneyBlog.com does not include all card companies or all available card offers. All opinions expressed are the author’s alone.

via GIPHY

Here’s a slightly-altered quarterly update on the income produced by my Humble Portfolio. I track the income produced as way to add a different view of performance. The total income goes up much more gradually and consistently than the number shown on brokerage statements (price), which helps encourage consistent investing. I imagine them as building up a factory that churns out dollar bills.

Annual income history. I started tracking the income from my portfolio in 2014. Here’s what the annual distributions from my portfolio look like over time:

  • $1,000,000 invested in my portfolio as of January 2014 would have generated about $24,000 in annual income over the previous 12 months. (2.4% starting yield)
  • If I reinvested the income but added no other contributions, today in 2022 it would have generated ~$46,000 in annual income over the previous 12 months.
  • If I spent every penny of the income every single year instead, today in 2022 it would still have generated ~$36,000 in annual income over the previous 12 months.

This chart shows how the annual income generated by my portfolio has changed.

TTM income yield. To estimate the income from my portfolio, I use the weighted “TTM” or “12-Month Yield” from Morningstar, which is the sum of the trailing 12 months of interest and dividend payments divided by the last month’s ending share price (NAV) plus any capital gains distributed (usually zero for index funds) over the same period. The trailing income yield for this quarter was 2.51%, as calculated below. Then I multiply by the current balance from my brokerage statements to get the total income.

Asset Class / Fund % of Portfolio Trailing 12-Month Yield Yield Contribution
US Total Stock (VTI) 25% 1.30% 0.33%
US Small Value (VBR) 5% 1.77% 0.09%
Int’l Total Stock (VXUS) 25% 3.21% 0.80%
Emerging Markets (VWO) 5% 2.96% 0.15%
US Real Estate (VNQ) 6% 2.78% 0.17%
Inter-Term US Treasury Bonds (VGIT) 17% 1.19% 0.20%
Inflation-Linked Treasury Bonds (VTIP) 17% 4.52% 0.77%
Totals 100% 2.51%


Stock market dividend growth over time. Stock dividends are a portion of profits that businesses have decided they don’t need to reinvest into their business. The dividends may suffer some short-term drops, but over the long run they have grown faster than inflation. The ratio of dividend payouts to price also serve as a rough valuation metric. When stock prices drop, this percentage metric usually goes up – which makes me feel better in a bear market. When stock prices go up, this percentage metric usually goes down, which keeps me from getting too euphoric during a bull market.

Here’s a related quote from Jack Bogle (source):

The true investor will do better if he forgets about the stock market and pays attention to his dividend returns and to the operating results of his companies.

If you retired back in 2014 and have been living off your stock/bond portfolio, your total income distributions are much higher in 2022 than in 2014. Here is the historical growth of the S&P 500 total dividend, which tracks roughly the largest 500 stocks in the US, updated as of Q1 2022 (via Yardeni Research):

This means that if you owned enough of the S&P 500 to produce an annual dividend income of about $26,000 a year in 1999, then today those same shares would be worth a lot more AND your annual dividend income would have increased to over $100,000 a year, even if you had spent every penny of dividend income every year!

Here is the historical growth of the total dividend of the EAFE iShares MSCI ETF, which tracks a broad index of developed non-US stocks (VXUS is a newer ETF), via Netcials.

European corporate culture seems to encourage paying out a higher percentage of earnings as dividends, but is also more forgiving of adjusting the dividends up and down with earnings. US corporate culture tends to be more conservative, with the expectation that dividends will be growing or at least stable. This is not true across every company, just a general observation.

Use as a retirement planning metric. It’s true that during the accumulation stage, your time is better spent focusing on earning potential via better career moves, improving in your skillset, and/or looking for entrepreneurial opportunities where you can have an ownership interest. As an overall numerical goal, I support the simple 4% or 3% rule of thumb, which equates to a target of accumulating roughly 25 to 30 times your annual expenses. I would lean towards a 3% withdrawal rate if you want to retire young (before age 50) and a 4% withdrawal rate if retiring at a more traditional age (closer to 65).

However, I find that tracking income makes more tangible sense in my mind and is more useful for those who aren’t looking for a traditional retirement. Our dividends and interest income are not automatically reinvested. They are another “paycheck”. Then, as with a traditional paycheck, we can choose to either spend it or invest it again to compound things more quickly. Even if we spend the dividends, this portfolio paycheck will still grow over time. You could use this money to cut back working hours, pursue a different career path, start a new business, take a sabbatical, perform charity or volunteer work, and so on. This is your one life and it only lasts about 4,000 weeks.

My Money Blog has partnered with CardRatings and may receive a commission from card issuers. Some or all of the card offers that appear on this site are from advertisers and may impact how and where card products appear on the site. MyMoneyBlog.com does not include all card companies or all available card offers. All opinions expressed are the author’s alone, and has not been provided nor approved by any of the companies mentioned.

MyMoneyBlog.com is also a member of the Amazon Associate Program, and if you click through to Amazon and make a purchase, I may earn a small commission. Thank you for your support.


MMB Humble Portfolio 2022 1st Quarter Update: Asset Allocation & Performance

My Money Blog has partnered with CardRatings and may receive a commission from card issuers. Some or all of the card offers that appear on this site are from advertisers and may impact how and where card products appear on the site. MyMoneyBlog.com does not include all card companies or all available card offers. All opinions expressed are the author’s alone.

portpie_blank200Here’s my quarterly update on my current investment holdings as of 4/8/22, including our 401k/403b/IRAs and taxable brokerage accounts but excluding a side portfolio of self-directed investments. Following the concept of skin in the game, the following is not a recommendation, but just to share an real, imperfect, low-cost, diversified DIY portfolio. The goal of this “Humble Portfolio” is to create sustainable income that keeps up with inflation to cover our household expenses.

TL;DR changes: Both stocks and bonds went down a small bit. Slightly overweight REITs, slightly underweight International Stocks. As usual, collected dividends and interest and reinvested available leftover cash.

Actual Asset Allocation and Holdings
I use both Personal Capital and a custom Google Spreadsheet to track my investment holdings. The Personal Capital financial tracking app (free, my review) automatically logs into my different accounts, adds up my various balances, tracks my performance, and calculates my overall asset allocation. Once a quarter, I also update my manual Google Spreadsheet (free, instructions) because it helps me calculate how much I need in each asset class to rebalance back towards my target asset allocation. I also create a new tab each quarter, so I have snapshot of my holdings dating back many years.

Here are updated performance and asset allocation charts, per the “Allocation” and “Holdings” tabs of my Personal Capital account.

Stock Holdings (same as last quarter)
Vanguard Total Stock Market (VTI, VTSAX)
Vanguard Total International Stock Market (VXUS, VTIAX)
Vanguard Small Value (VBR)
Vanguard Emerging Markets (VWO)
Avantis International Small Cap Value ETF (AVDV)
Cambria Emerging Shareholder Yield ETF (EYLD)
Vanguard REIT Index (VNQ, VGSLX)

Bond Holdings
Vanguard Limited-Term Tax-Exempt (VMLTX, VMLUX)
Vanguard Intermediate-Term Tax-Exempt (VWITX, VWIUX)
Vanguard Intermediate-Term Treasury (VFITX, VFIUX)
Vanguard Inflation-Protected Securities (VIPSX, VAIPX)
Fidelity Inflation-Protected Bond Index (FIPDX)
iShares Barclays TIPS Bond (TIP)
Individual TIPS bonds
U.S. Savings Bonds (Series I)

Target Asset Allocation. This “Humble Portfolio” does not rely on my ability to pick specific stocks, sectors, trends, or countries. I own broad, low-cost exposure to asset classes that will provide long-term returns above inflation, distribute income via dividends and interest, and finally offer some historical tendencies to balance each other out. I have faith in the long-term benefit of owning publicly-traded US and international shares of businesses, as well as high-quality US Treasury and municipal debt. My stock holdings roughly follow the total world market cap breakdown at roughly 60% US and 40% ex-US. Some minor wrinkles are the inclusion of “small value” ETFs for US, Developed International, and Emerging Markets stocks as well as additional real estate exposure through US REITs.

I strongly believe in the importance of knowing WHY you own something. Every asset class will eventually have a low period, and you must have strong faith during these periods to truly make your money. You have to keep owning and buying more stocks through the stock market crashes. You have to maintain and even buy more rental properties during a housing crunch, etc. A good sign is that if prices drop, you’ll want to buy more of that asset instead of less. I don’t have strong faith in the long-term results of commodities, gold, or bitcoin – so I don’t own them. Simple as that.

I do not spend a lot of time backtesting various model portfolios, as I don’t think picking through the details of the recent past will necessarily create superior future returns. Usually, whatever model portfolio is popular in the moment just happens to hold the asset class that has been the hottest recently as well.

Find productive assets that you believe in and understand, and just keep buying them through the ups and downs. Mine may be different than yours.

Stocks Breakdown

  • 45% US Total Market
  • 7% US Small-Cap Value
  • 31% International Total Market
  • 7% International Small-Cap Value
  • 10% US Real Estate (REIT)

Bonds Breakdown

  • 66% High-Quality bonds, Municipal, US Treasury or FDIC-insured deposits
  • 34% US Treasury Inflation-Protected Bonds (or I Savings Bonds)

I have settled into a long-term target ratio of 67% stocks and 33% bonds (2:1 ratio) within our investment strategy of buy, hold, and occasionally rebalance. This is more conservative than most people my age, but I am settling into a more “perpetual income portfolio” as opposed to the more common “build up a big stash and hope it lasts until I die” portfolio. My target withdrawal rate is 3% or less. With a self-managed, simple portfolio of low-cost funds, we can minimize management fees, commissions, and taxes.

Holdings commentary. I know I sound like a broken record, but really, my best investment decisions have been convincing myself to do nothing during times of stress. Sometimes it was easy, sometimes it was hard. Still, after investing steadily for over 15 years, my results have exceeded my expectations and the fluctuations are now often greater than my annual spending. To make it easier, I try to ignore daily talk about stock movements.

There is ALWAYS something that looks worrying. I am a “buy, hold, and cash the checks” kind of investor. I often wonder how I can teach my children such patience in investing, and that seems to be the hardest aspect.

Performance numbers. According to Personal Capital, my portfolio down about 6% for 2022 YTD. US stocks, International stocks, and even US bonds are all down roughly 6-8%. REITs are the only things that went up. As such, in terms of rebalancing, the portfolio is slightly overweight in REITs and slightly underweight in International Stocks, so that is where the excess cash will be invested this quarter.

I’ll share about more about the income aspect in a separate post.

My Money Blog has partnered with CardRatings and may receive a commission from card issuers. Some or all of the card offers that appear on this site are from advertisers and may impact how and where card products appear on the site. MyMoneyBlog.com does not include all card companies or all available card offers. All opinions expressed are the author’s alone, and has not been provided nor approved by any of the companies mentioned.

MyMoneyBlog.com is also a member of the Amazon Associate Program, and if you click through to Amazon and make a purchase, I may earn a small commission. Thank you for your support.


MMB Portfolio 2021 Year-End (Late Update): Dividend and Interest Income

My Money Blog has partnered with CardRatings and may receive a commission from card issuers. Some or all of the card offers that appear on this site are from advertisers and may impact how and where card products appear on the site. MyMoneyBlog.com does not include all card companies or all available card offers. All opinions expressed are the author’s alone.

dividendmono225Here’s my (late) quarterly update on the income produced by my “Humble Portfolio“. The total income goes up much more gradually and consistently than the number shown on brokerage statements (price), encouraging me as I keep plowing more of my savings into more stock purchases. I imagine them as a factory that just churns out more dollar bills.

via GIPHY

Income yield history (percentage of portfolio value). Here is a chart showing how this 12-month trailing income rate has varied since I started tracking it in 2014. There appears to be a slight recovery from the early pandemic time period.

I track the “TTM” or “12-Month Yield” from Morningstar, which is the sum of the trailing 12 months of interest and dividend payments divided by the last month’s ending share price (NAV) plus any capital gains distributed over the same period. (ETFs rarely have to distribute capital gains.) I prefer this measure because it is based on historical distributions and not a forecast. Below is a rough approximation of my portfolio (2/3rd stocks and 1/3rd bonds).

Asset Class / Fund % of Portfolio Trailing 12-Month Yield (Taken 1/24/22) Yield Contribution
US Total Stock
Vanguard Total Stock Market Fund (VTI, VTSAX)
25% 1.21% 0.30%
US Small Value
Vanguard Small-Cap Value ETF (VBR)
5% 1.75% 0.09%
International Total Stock
Vanguard Total International Stock Market Fund (VXUS, VTIAX)
25% 3.09% 0.77%
Emerging Markets
Vanguard Emerging Markets ETF (VWO)
5% 2.64% 0.13%
US Real Estate
Vanguard REIT Index Fund (VNQ, VGSLX)
6% 2.56% 0.15%
Intermediate-Term High Quality Bonds
Vanguard Intermediate-Term Treasury ETF (VGIT)
17% 1.14% 0.19%
Inflation-Linked Treasury Bonds
Vanguard Short-Term Inflation-Protected Securities ETF (VTIP)
17% 4.69% 0.80%
Totals 100% 2.44%


Stock dividends are the portion of profits that businesses have decided they don’t need to reinvest into their business. The dividends may suffer some short-term drops, but over the long run they have grown faster than inflation.

The ratio of dividend payouts to price also serve as a rough valuation metric. When stock prices drop, this percentage metric usually goes up – which makes me feel better in a bear market. When stock prices go up, this percentage metric usually goes down, which keeps me from getting too euphoric during a bull market.

Here’s a related quote from Jack Bogle (source):

The true investor will do better if he forgets about the stock market and pays attention to his dividend returns and to the operating results of his companies.

Absolute dividend history. Even though the dividend yield hasn’t been too impressive, there is a different story when you look at the absolute amount of income paid out over time. If you retired back in 2014 and have been living off your stock/bond portfolio, your total income distributions are much higher in 2022 than in 2014.

Here is the historical growth of the S&P 500 absolute dividend, which tracks roughly the largest 500 stocks in the US, updated as of Q4 2021 (via Yardeni Research):

This means that if you owned enough of the S&P 500 to produce an annual dividend income of about $13,000 a year in 1999, then today those same shares would be worth a lot more AND your annual dividend income would have increased to over $50,000 a year, even if you had spent every penny of dividend income every year.

Here is the historical growth of the absolute dividend of the EAFE iShares MSCI ETF, which tracks a broad index of developed non-US stocks (VXUS is a newer ETF), via Netcials.

European dividend culture seems to encourage paying out a higher percentage of earnings as dividends, but as a result those dividends are also more volatile, moving up and down with earnings. US dividend culture tends to be more conservative, with the expectation that dividends will be growing or at least stable. This is not true across every company, but in general there appears to be a greater stigma associated with dividend cuts in US stocks than in international stocks.

Big picture and rules of thumb. If you are not close to retirement, there is not much use worrying about decimal points. Your time is better spent focusing on earning potential via better career moves, improving in your skillset, and/or looking for entrepreneurial opportunities where you can have an ownership interest.

As a result, I support the simple 4% or 3% rule of thumb, which equates to a target of accumulating roughly 25 to 30 times your annual expenses. I would lean towards a 3% withdrawal rate if you want to retire young (before age 50) and a 4% withdrawal rate if retiring at a more traditional age (closer to 65). Build in some spending flexibility to make your portfolio more resilient in the real world, and that’s a reasonable goal to put on your wall.

Using the income before “full” retirement. Our dividends and interest income are not automatically reinvested. I treat this money as part of our “paycheck”. Then, as with a traditional paycheck, we can choose to either spend it or invest it again to compound things more quickly. Even if still working, you could use this money to cut back working hours, pursue a different career path, start a new business, take a sabbatical, perform charity or volunteer work, and so on. This is your one life and it only lasts about 4,000 weeks.

My Money Blog has partnered with CardRatings and may receive a commission from card issuers. Some or all of the card offers that appear on this site are from advertisers and may impact how and where card products appear on the site. MyMoneyBlog.com does not include all card companies or all available card offers. All opinions expressed are the author’s alone, and has not been provided nor approved by any of the companies mentioned.

MyMoneyBlog.com is also a member of the Amazon Associate Program, and if you click through to Amazon and make a purchase, I may earn a small commission. Thank you for your support.


MMB Portfolio 2021 Year-End (Late Update): Asset Allocation & Performance

My Money Blog has partnered with CardRatings and may receive a commission from card issuers. Some or all of the card offers that appear on this site are from advertisers and may impact how and where card products appear on the site. MyMoneyBlog.com does not include all card companies or all available card offers. All opinions expressed are the author’s alone.

portpie_blank200Here’s my (late) quarterly update on my current investment holdings, as of 1/23/22, including our 401k/403b/IRAs and taxable brokerage accounts but excluding a side portfolio of self-directed investments. Following the concept of skin in the game, the following is not a recommendation, but just to share an real, imperfect, low-cost, diversified DIY portfolio. The goal of this portfolio is to create sustainable income that keeps up with inflation to cover our household expenses.

Actual Asset Allocation and Holdings
I use both Personal Capital and a custom Google Spreadsheet to track my investment holdings. The Personal Capital financial tracking app (free, my review) automatically logs into my different accounts, adds up my various balances, tracks my performance, and calculates my overall asset allocation. Once a quarter, I also update my manual Google Spreadsheet (free, instructions) because it helps me calculate how much I need in each asset class to rebalance back towards my target asset allocation.

Here are updated performance and asset allocation charts, per the “Allocation” and “Holdings” tabs of my Personal Capital account.

Stock Holdings
Vanguard Total Stock Market (VTI, VTSAX)
Vanguard Total International Stock Market (VXUS, VTIAX)
Vanguard Small Value (VBR)
Vanguard Emerging Markets (VWO)
Avantis International Small Cap Value ETF (AVDV)
Cambria Emerging Shareholder Yield ETF (EYLD)
Vanguard REIT Index (VNQ, VGSLX)

Bond Holdings
Vanguard Limited-Term Tax-Exempt (VMLTX, VMLUX)
Vanguard Intermediate-Term Tax-Exempt (VWITX, VWIUX)
Vanguard Intermediate-Term Treasury (VFITX, VFIUX)
Vanguard Inflation-Protected Securities (VIPSX, VAIPX)
Fidelity Inflation-Protected Bond Index (FIPDX)
iShares Barclays TIPS Bond (TIP)
Individual TIPS bonds
U.S. Savings Bonds (Series I)

Target Asset Allocation. This “Humble Portfolio” does not rely on my ability to pick specific stocks, sectors, trends, or countries. I own broad, low-cost exposure to asset classes that will provide long-term returns above inflation, distribute income via dividends and interest, and finally offer some historical tendencies to balance each other out. I have faith in the long-term benefit of owning publicly-traded US and international shares of businesses, as well as high-quality US federal and municipal debt. My stock holdings roughly follow the total world market cap breakdown at roughly 60% US and 40% ex-US. I also own real estate through REITs.

I strongly believe in the importance of “knowing WHY you own something”. Every asset class will eventually have a low period, and you must have strong faith during these periods to truly make your money. You have to keep owning and buying more stocks through the stock market crashes. You have to maintain and even buy more rental properties during a housing crunch, etc. You might own laundromats or vending machines or an online business. A good sign is that if prices drop, you’ll want to buy more of that asset instead of less.

Find a good asset that you believe in and understand, and just keep buying it through the ups and downs.

I do not spend a lot of time backtesting various model portfolios, as I don’t think picking through the details of the recent past will necessarily create superior future returns. Usually, whatever model portfolio is popular in the moment just happens to hold the asset class that has been the hottest recently as well. I’ve also realized that I don’t have strong faith in the long-term results of commodities, gold, or bitcoin. I’ve tried many times to wrap my head around it, but have failed. I prefer things that send me checks while I sleep.

Stocks Breakdown

  • 45% US Total Market
  • 7% US Small-Cap Value
  • 31% International Total Market
  • 7% International Small-Cap Value
  • 10% US Real Estate (REIT)

Bonds Breakdown

  • 66% High-Quality bonds, Municipal, US Treasury or FDIC-insured deposits
  • 33% US Treasury Inflation-Protected Bonds (or I Savings Bonds)

I have settled into a long-term target ratio of 67% stocks and 33% bonds (2:1 ratio) within our investment strategy of buy, hold, and occasionally rebalance. This is more conservative than most people my age, but I am settling into a more “perpetual” as opposed to the more common “build up a big stash and hope it lasts until I die” portfolio. My target withdrawal rate is 3% or less. With a self-managed, simple portfolio of low-cost funds, we can minimize management fees, commissions, and taxes.

Holdings commentary. I’ve been investing steadily for over 15 years, and the results have exceeded my expectations. There is ALWAYS something that looks worrying. Looking back, my best investment decisions were to NOT do anything different during times of stress. Maybe 2022 will have more such times. Ignore the noise, if you can.

I often wonder how I can teach my children such patience in investing, and that seems to be the hardest aspect.

Performance numbers. According to Personal Capital, my portfolio is up another +13.9% for 2021.

I’ll share about more about the income aspect in a separate post.

My Money Blog has partnered with CardRatings and may receive a commission from card issuers. Some or all of the card offers that appear on this site are from advertisers and may impact how and where card products appear on the site. MyMoneyBlog.com does not include all card companies or all available card offers. All opinions expressed are the author’s alone, and has not been provided nor approved by any of the companies mentioned.

MyMoneyBlog.com is also a member of the Amazon Associate Program, and if you click through to Amazon and make a purchase, I may earn a small commission. Thank you for your support.


MMB Portfolio Update October 2021 (Q3): Dividend and Interest Income

My Money Blog has partnered with CardRatings and may receive a commission from card issuers. Some or all of the card offers that appear on this site are from advertisers and may impact how and where card products appear on the site. MyMoneyBlog.com does not include all card companies or all available card offers. All opinions expressed are the author’s alone.

dividendmono225While my 3rd Quarter 2021 portfolio asset allocation is designed for total return, I also track the income produced quarterly. Stock dividends are the portion of profits that businesses have decided they don’t need to reinvest into their business. The dividends may suffer some short-term drops, but over the long run they have grown faster than inflation.

I track the “TTM” or “12-Month Yield” from Morningstar, which is the sum of the trailing 12 months of interest and dividend payments divided by the last month’s ending share price (NAV) plus any capital gains distributed over the same period. (ETFs rarely have to distribute capital gains.) I prefer this measure because it is based on historical distributions and not a forecast. Below is a rough approximation of my portfolio (2/3rd stocks and 1/3rd bonds).

Asset Class / Fund % of Portfolio Trailing 12-Month Yield (Taken 10/17/21) Yield Contribution
US Total Stock
Vanguard Total Stock Market Fund (VTI, VTSAX)
25% 1.28% 0.32%
US Small Value
Vanguard Small-Cap Value ETF (VBR)
5% 1.67% 0.08%
International Total Stock
Vanguard Total International Stock Market Fund (VXUS, VTIAX)
25% 2.56% 0.64%
Emerging Markets
Vanguard Emerging Markets ETF (VWO)
5% 2.25% 0.11%
US Real Estate
Vanguard REIT Index Fund (VNQ, VGSLX)
6% 2.65% 0.16%
Intermediate-Term High Quality Bonds
Vanguard Intermediate-Term Treasury ETF (VGIT)
17% 1.18% 0.20%
Inflation-Linked Treasury Bonds
Vanguard Short-Term Inflation-Protected Securities ETF (VTIP)
17% 2.26% 0.38%
Totals 100% 1.89%


Trailing 12-month yield history. Here is a chart showing how this 12-month trailing income rate has varied since I started tracking it in 2014.

Maintaining perspective on portfolio value. One of the things I like about using this number is that when stock prices drop, this percentage metric usually goes up – which makes me feel better in a bear market. When stock prices go up, this percentage metric usually goes down, which keeps me from getting too euphoric during a bull market.

Here’s a related quote from Jack Bogle (source):

The true investor will do better if he forgets about the stock market and pays attention to his dividend returns and to the operating results of his companies.

Absolute dividend income. This quarter’s trailing income yield of 1.89% is still near the all-time lows since 2014. At the same time, both the portfolio value and the absolute income produced is higher than in 2014. If you retired back in 2014 and have been living off your stock/bond portfolio, you’ve been doing fine.

Here is the historical growth of the S&P 500 absolute dividend, updated as of Q3 2021 (source):

This means that if you owned enough of the S&P 500 to produce an annual dividend income of about $13,000 a year in 1999, then today those same shares would be worth a lot more AND your annual dividend income would have increased to over $50,000 a year, even if you had spent every penny of dividend income every year.

As a result, I prefer looking at absolute income produced rather than portfolio value or dividend yield percentages. Total income goes up much more gradually and consistently, encouraging me as I keep plowing more of my savings into more stock purchases. I imagine them as a factory that just churns out more dollar bills.

via GIPHY

Big picture and rules of thumb. If you are not close to retirement, there is not much use worrying about these decimal points. Your time is better spent focusing on earning potential via better career moves, improving in your skillset, and/or looking for entrepreneurial opportunities where you can have an ownership interest.

I support the common 4% or 3% rule of thumb, which equates to a target of accumulating roughly 25 to 30 times your annual expenses. I would lean towards a 3% withdrawal rate if you want to retire young (before age 50) and a 4% withdrawal rate if retiring at a more traditional age (closer to 65). Build in some spending flexibility to make your portfolio more resilient in the real world, and that’s perfectly good goal to put on your wall.

How we handle this income. Our dividends and interest income are not automatically reinvested. I treat this money as part of our “paycheck”. Then, as with a traditional paycheck, we can choose to either spend it or invest it again. Even if still working, you could use this money to cut back working hours, pursue new interests, start a new business, spend more time with your family and loved ones, travel, perform charity or volunteer work, and so on. This is your one life and it only lasts about 4,000 weeks.

My Money Blog has partnered with CardRatings and may receive a commission from card issuers. Some or all of the card offers that appear on this site are from advertisers and may impact how and where card products appear on the site. MyMoneyBlog.com does not include all card companies or all available card offers. All opinions expressed are the author’s alone, and has not been provided nor approved by any of the companies mentioned.

MyMoneyBlog.com is also a member of the Amazon Associate Program, and if you click through to Amazon and make a purchase, I may earn a small commission. Thank you for your support.