I enjoy reading articles by Scott Burns (also here) because he sometimes offers a unique perspective on things. He recently released the 2015 Annual Letter for his asset management company AssetBuilder. The whole thing is a good read, but here are two items of note:
Keep in mind the effect of currency fluctuations on your portfolio returns. In 2014, the MSCI European Index fell 6% in dollars. However, that index actually rose nearly 7% in Euros. Most international stock funds sold to US investors, including the Vanguard Total International Index fund, are not currency-hedged. The strong dollar in 2014 has made international returns looks worse from a dollar-based perspective.
At the same time, the dollar rose against other currencies. Over the year, the dollar gained 12.5 percent against a basket of widely traded currencies tracked by the Wall Street Journal. That increase created a looking glass problem. U.S. investors felt investing in Europe was a losing proposition, with the MSCI Europe Index falling 6.18 percent in dollars.
Europeans, meanwhile, felt differently because the index rose 6.84 percent in Euros. Indeed, the world looked strangely positive to an internationally diversified Russian investor. Thanks to the miracle of modern currency collapse, international portfolios measured in Rubles soared. We doubt that gave Russian investors great comfort.
I still like the idea of having my portfolio diversified globally, and hopefully this makes you feel a little better about the recent performance of your international holdings. This will someday work in reverse, where currency fluctuations makes returns look even better.
Also included is an interactive table of asset classes ranked by returns over the last 15 years, similar to the Callan Periodic Table. But with this graphic, you can hover your mouse over any asset class and see it in highlighted. Here it is with the S&P 500:
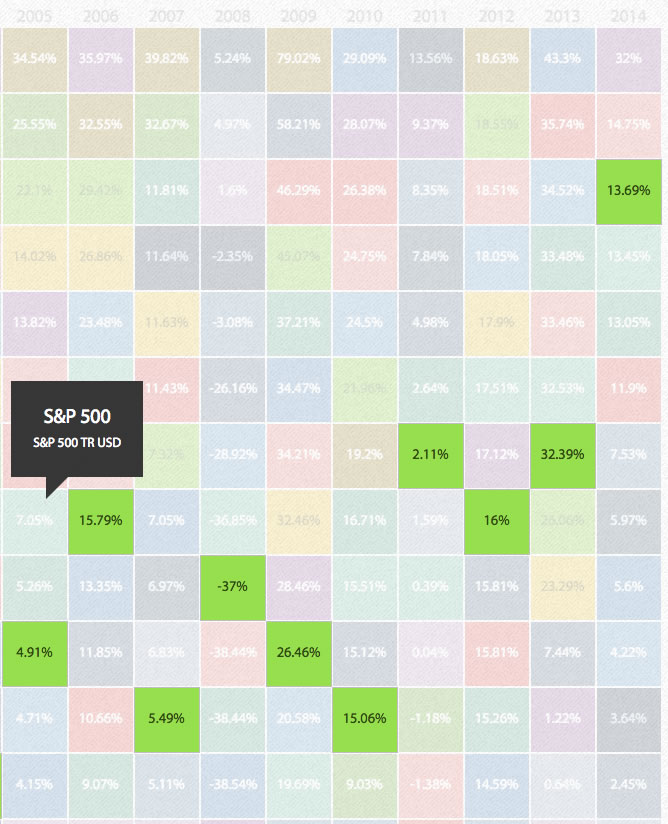
Notice that the S&P 500 has had quite a run the last 6 years. Since the -37% drop in 2008, in subsequent years 2009-2014 the S&P 500 has went up 26%, 15%, 2%, 16%, 32%, and 14%. It would have been really hard for the “I’ll buy on the next dip” folks to time their way back in the market. If you’ve been invested throughout the entire time, you should be rather pleased with yourself.
 The Best Credit Card Bonus Offers – March 2024
 Big List of Free Stocks from Brokerage Apps
 Best Interest Rates on Cash - March 2024
 Free Credit Scores x 3 + Free Credit Monitoring
 Best No Fee 0% APR Balance Transfer Offers
 Little-Known Cellular Data Plans That Can Save Big Money
 How To Haggle Your Cable or Direct TV Bill
 Big List of Free Consumer Data Reports (Credit, Rent, Work)
Diversification across geographic areas, industries, asset classes is important, and will let you sleep well at night when something bad happens. And it probably will happen sooner or later.
Of course, if you have a 20 – 30 year time frame ahead of you, year-over-year fluctuations in asset prices should not really matter much.
Very well said.
Thank you for the resource.
Does this mean buying more European stock to rebalance a portfolio is essentially chasing the market as well in some sense?
I don’t think so, it’s just another facet to the story.
Great tips here! I’m really loving that graphic table… it’s great to have a visual way to display things like finances. Thanks for sharing!
Are you sure that VTIAX is currency hedged? I don’t think that’s correct.
Ack, there should be a NOT in there. Thanks, I’m surprised nobody else pointed that out. Let’s get this one right… most money in international stock funds are not currency-hedged. For example EFA is popular iShares MSCI EAFA Index ETF that is not currency-hedged with $55 billion in assets, while HEFA is their currency-hedged ETF version but with only $1 billion in assets.