T. Rowe Price (TRP) announced a new free tool called Social Security Optimizer to help decide when to start claiming Social Security benefits. You enter information like age, marital status, life expectancy, spousal information, and “Monthly Benefit Amount At Full Retirement Age”. It will ask you to register with your email address, but it is otherwise free. (After you register, you also get access to other free TRP tools.)
The new tool, which provides tailored insights through analysis of an individual’s specific circumstances, estimates when to begin claiming Social Security and how much they should expect to receive. Social Security Optimizer can also model life expectancy to see what claiming strategies will yield the most amount of money over time based on the inputted life expectancy. Individuals are guided through a short series of questions. The tool will then estimate the optimal age to take Social Security, the optimal age for their partner to take Social Security, and the amount of benefit the individual (and their partner) will receive, given their assumed life expectancy. The Social Security Optimizer also pairs broader education and resources to help individual investors and plan participants make more informed decisions.
Based on my initial tests, the tool is on the basic side. They do recommend a specific claiming strategy and provide some useful background information about how Social Security works, but it doesn’t go into much detail about all of the possible scenarios. I was honestly hoping for something more full-featured given that in March 2023, T. Rowe Price announced that it was acquiring Retiree Inc., which included several advanced software tools for both individuals and professional financial advisors like SSAnalyzer.com, Income Solver®, and Social Security Solutions™.
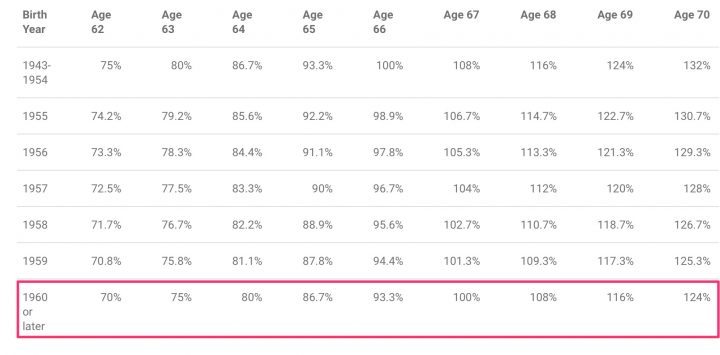
I’d still recommend checking it out, as Social Security claim timing is a big decision and I think exploring and using all available information is a good idea. These tools can introduce a lot of people to ideas that they would have not otherwise considered, like perhaps having one spouse claim as early as possible (age 62), and then have the other claim as late as possible (age 70).
Other free third-party Social Security tools that I recommend trying out include Open Social Security and SSA.tools.
A reminder that this tool (and all the others) will help to maximize the total income that you receive from Social Security. Often this means one or both spouses delay their claim date to age 70. This works out fine if you have alternative sources of income while you delay your claim start date. However, if you need the Social Security income to retire sooner (often now), then that is a new variable to work in. Income that lets you retire and stop working today when you are younger and healthier may be worth more than what comes out of some discounted interest rate analysis.
I’ve also found there is often a behavioral psychology element. For example, if one spouse stops working first while the other continues to work, the non-working spouse may feel an urge to have their “own income” and want to start claiming Social Security as soon as possible.


 If you have accumulated some savings bonds but don’t really enjoy logging into TreasuryDirect.gov all the time, here are some alternative methods to tracking your balances over time. Each has its own strengths and weaknesses, and the unofficial ones are the results of motivated DIY investors. As an example, I will track a Savings I Bond purchased in April 2013 for $10,000.
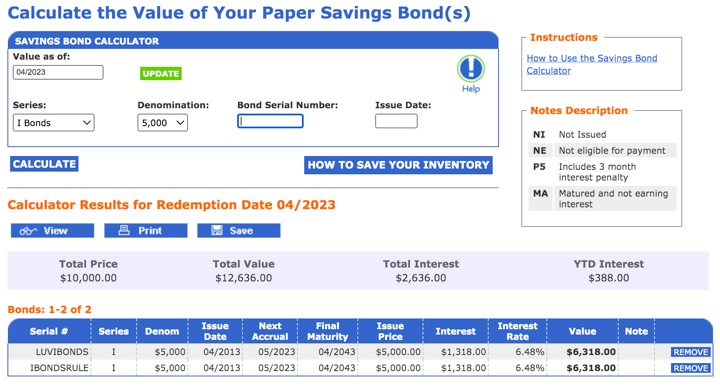
 While updating my posts on
 If you are an individual investor that usually buys bank certificates of deposit, right now you may want to compare against a US Treasury bond of similar maturity. Treasury bond rates are traded constantly, but this

 Schwab has rolled out a new digital financial planning tool called
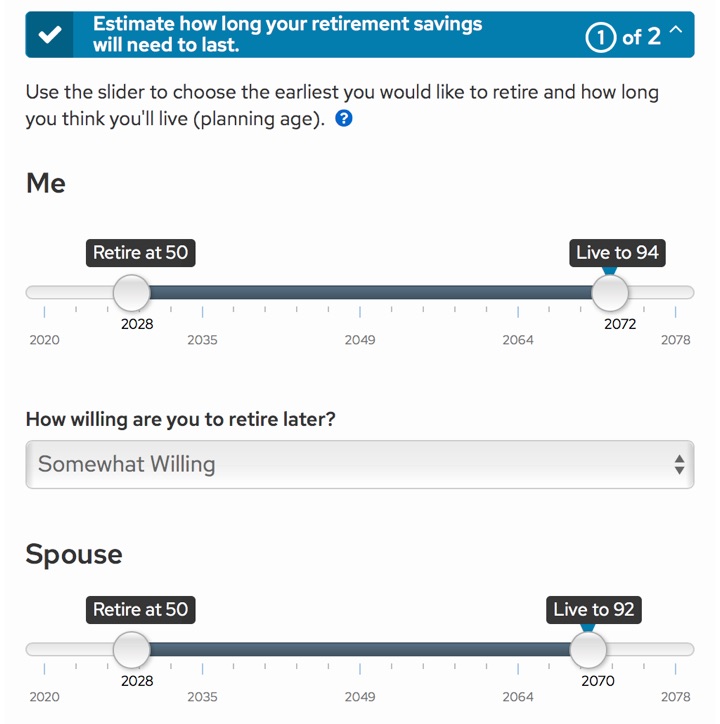
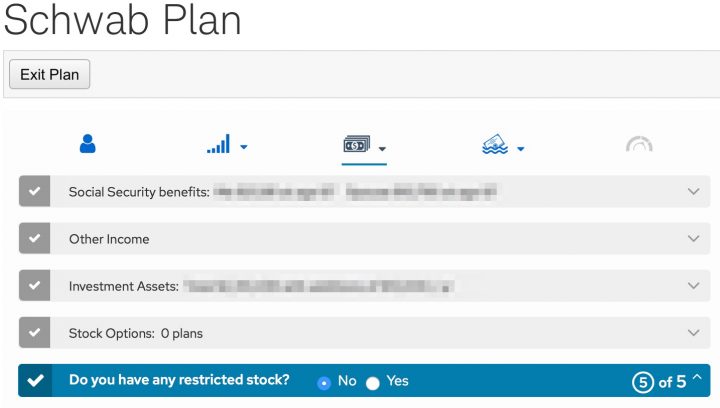
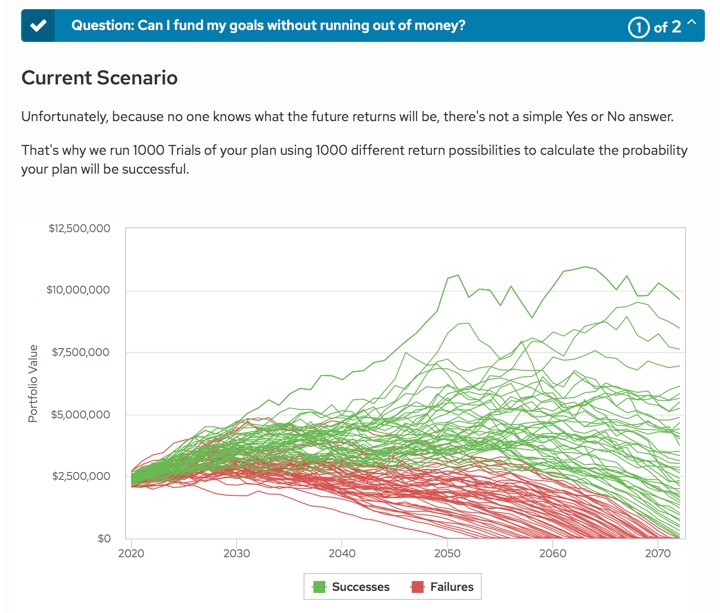
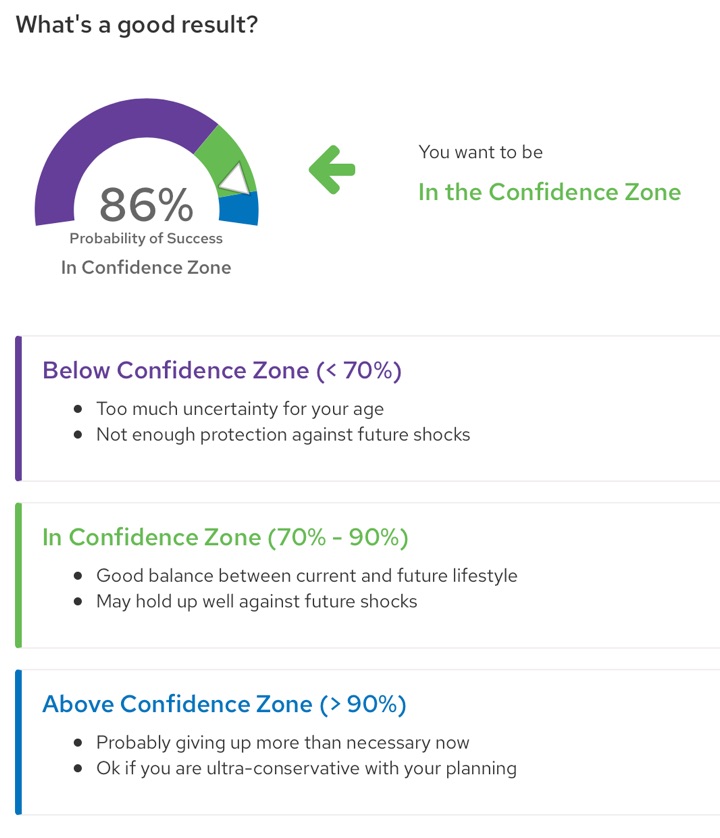
 Thanks to generous assistance from a reader, I was able to spend some time poking around the
 When to start claiming Social Security to maximize your potential benefit can be a complicated question, especially for couples. There are multiple paid services that will run the numbers for you, including
  You’ve probably heard of the “4% rule” when withdrawing income from a retirement portfolio. I think using such a rule is fine when you are early in the accumulation phase, although I like the “3% rule” better for early (long) retirements. But heck, reach 25x expenses first and then reassess. However, when it’s actually time to spend down that money, the execution can be tricky. If you start out taking 4% on a $1,000,000 portfolio ($40,000) and then the market drops 50%, will you really take $40,000 (8%) out of your sub-$500,000 portfolio the next year?
 The Best Credit Card Bonus Offers – March 2024
 Big List of Free Stocks from Brokerage Apps
 Best Interest Rates on Cash - March 2024
 Free Credit Scores x 3 + Free Credit Monitoring
 Best No Fee 0% APR Balance Transfer Offers
 Little-Known Cellular Data Plans That Can Save Big Money
 How To Haggle Your Cable or Direct TV Bill
 Big List of Free Consumer Data Reports (Credit, Rent, Work)